


FXOpen
Contracting triangles are the favorite way for a market to consolidate. Whenever you think of a possible range to form, the chances are that the market will form a contracting triangle.
The name is not random. The contracting nature of a triangle comes from the two trendlines that define it.
Before going into more technical details, here’s a bit of historical background of triangular formations. As you’ll find out, triangles were one of the first patterns noticed by pattern recognition traders that set the ground for technical analysis as we know it today.
The earliest mentioning of a contracting triangle comes from the 1900’s stock market. Or, maybe a bit earlier, but not by many decades.
Traders noticed price patterns forming before important levels gave way. This is how the notion of an ascending and descending triangle was born.
Effectively, the patterns belonged to a rising or falling trend. For a while, the market hesitated before breaking higher or lower.
That hesitation/consolidation was documented as an ascending/descending triangle. The price builds energy before continuing the trend.
Contracting Triangles in Today’s Markets
Nowadays, traders are aware of contracting triangles of all types. Ascending or descending triangles are just general terms for a triangular formation.
The first one to document a contracting triangle was Ralph N. Elliott. The father of the Elliott Wave Theory, he established the rules of a contracting triangle.
More precisely, the rules define a contracting triangle and, based on them, traders forecast the future price action.
We’ll only mention in this article that Elliott used letters to define a triangle’s nature and set a rule that a triangle only has five segments. Hence, the a-b-c-d-e labeling comes naturally.
Based on that simple approach to a triangular formation, the rest of this article will focus on the tips and tricks to trade it.
Tips for Trading a Contracting Triangle
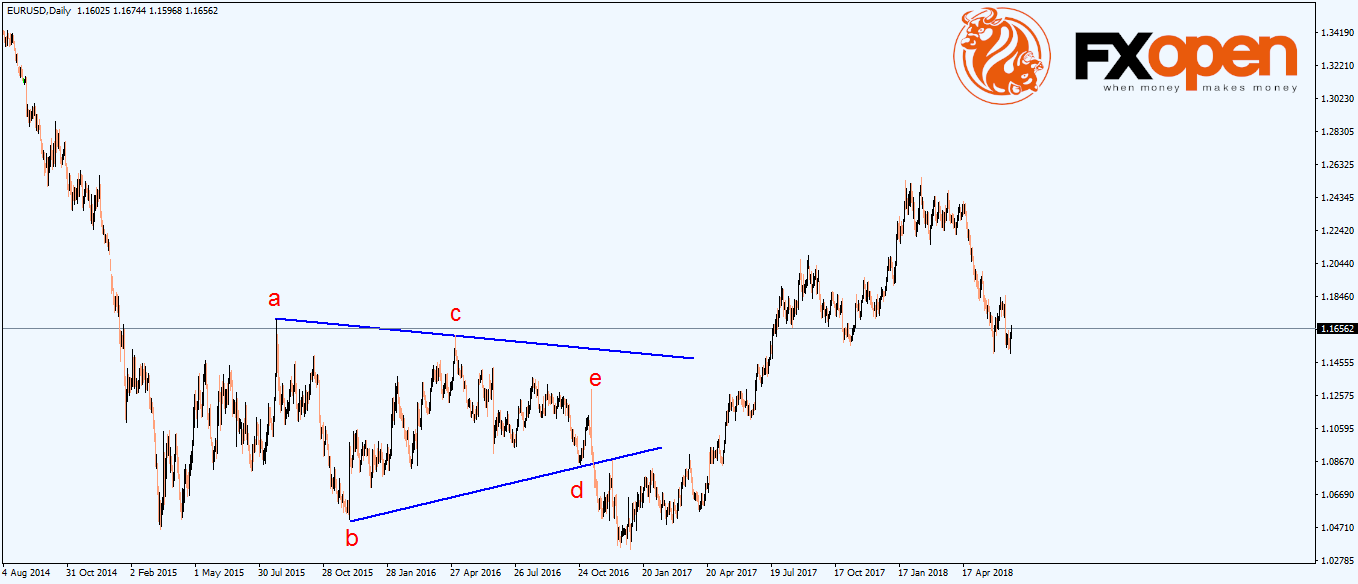
Many traders wonder where the term contracting comes from? The two trendlines shown on the above chart tell the answer.
If one projects them on the right side, they’ll meet somewhere. They’ll intersect eventually.
So, a contracting triangle comes from the a-c and b-d trendlines. They contract, pointing to a cross somewhere in the future.
Here are some tips to trade any contracting triangle:
- Focus on the b-d trendline – when broken, it tells much about the future price action;
- A triangle has a measured move – typically it relates to 61.8% of the most extended segment;
- Most of the times the price retests the b-d trendline; effectively, it means that it will return to it, before resuming in the direction of the break.
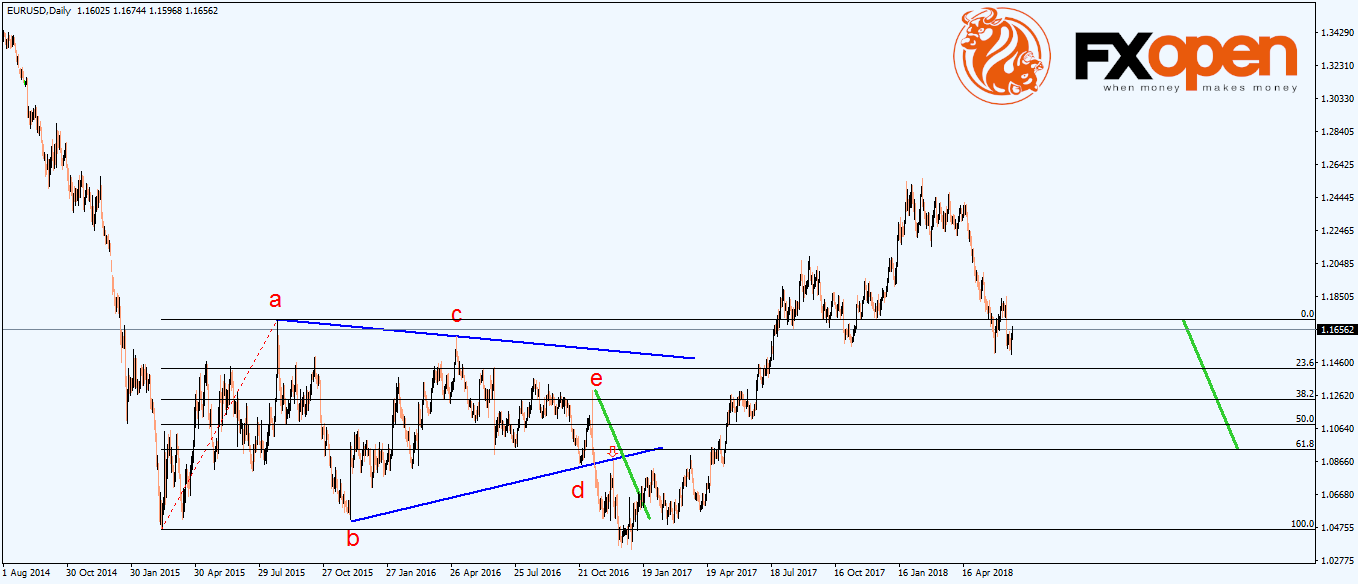
So, the price broke the b-d trend-line. Bearish sign!
Savvy traders use a Fibonacci retracement tool to measure the length of the triangle’s longest segment. In this case, the a-wave.
Next, traders find the 61.8% ratio (a.k.a. the golden ratio) and project it from the end of the e-wave.
Finally, they wait for a break and retest before going for the measured move.
Conclusion
Note the word tips. It means that these aren’t rules, but common price developments after such patterns form.
Because of the way we interact with financial markets changes, the rules will change too. For instance, in today’s Forex trading (and not only) most of the trading is automated.
In fact, over eighty percent of it is automated. Robots sell or buy. Not humans.
But event these robots follows instructions. Moreover, the guidelines are set by humans.
Hence, the rules of a triangle, as explained here, belong to traders documenting a pattern. The rest is just trading noise.
This article represents the opinion of the Companies operating under the FXOpen brand only. It is not to be construed as an offer, solicitation, or recommendation with respect to products and services provided by the Companies operating under the FXOpen brand, nor is it to be considered financial advice.
Latest articles

Google Share Price Rose Post-market to a New All-time Record
Yesterday, after the close of the main trading session, a report on activities for the 1st quarter of Alphabet Inc. (Google's parent company) was published. The report was strong, exceeding investors' expectations.
→ Quarterly EPS = USD 1.89 (expected = USD 1.

S&P 500 Rebounds after Negative GDP News
Data released yesterday showed US GDP growth slowed to 1.6% in the first quarter of the year. According to ForexFactory: forecast = 2.2%, past value = 2.4%.
Reaction to the news sent the S&P 500 mini stock

GBP/USD And USD/CAD Daily Chart Outlook
GBP/USD is attempting a recovery wave from 1.2300. USD/CAD is consolidating and might aim for a move above the 1.3760 resistance zone.
Important Takeaways for GBP/USD and USD/CAD Analysis Today
· The British Pound started