


FXOpen
Assessment of naked price movement in order to identify key support/resistance and potential reversal levels is known as price action analysis. Price action traders don’t use lagging indicators or complex trading systems, they rather focus on plain charts that provide every single piece of information required to be successful in forex trading. Here in this article we are going to discuss some common price action strategies.
Swing Analysis
The analysis based on “Swings” (high/low of candles) is known as Swing Analysis. For instance, consider the following monthly chart of EURUSD. It shows consistent Lower Lows and Lower Highs which is an indication of steady bearish trend. In this scenario, price action traders prefer selling on rallies.
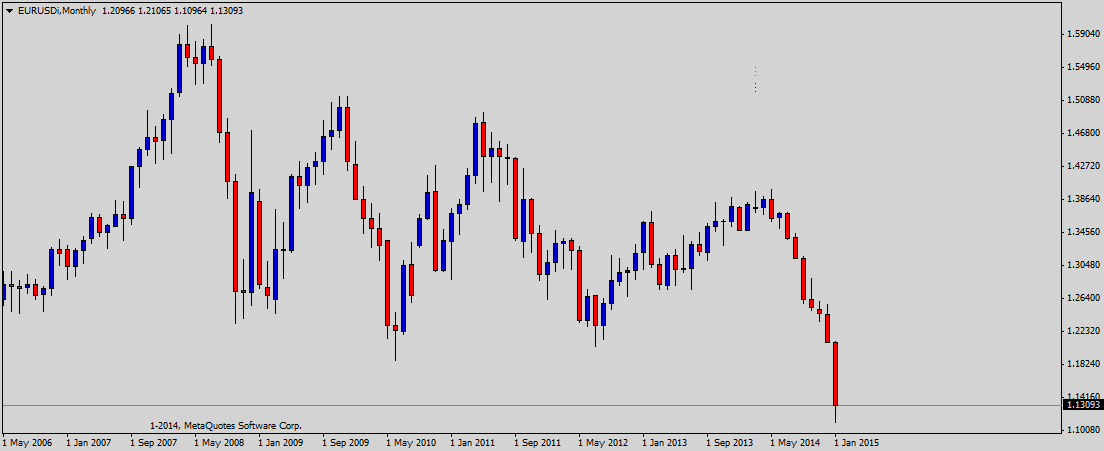
Similarly, Higher Highs and Higher Lows indicate bullish trend in the price, prompting traders to consider buying on dips. Swing analysis is considered one of the best tools for identify the ongoing trend. It is considered reliable on four-hour or higher timeframe.
Trendlines
Identifying potential reversal or continuity in trend with the help of trendlines is another very effective price action strategy. Consider the following weekly chart of gold. As you can see, the lower trendline or channel support is obtained by connecting the lowest levels of various candles while the upper trendline or channel resistance is obtained by joining the highest levels of different candles.
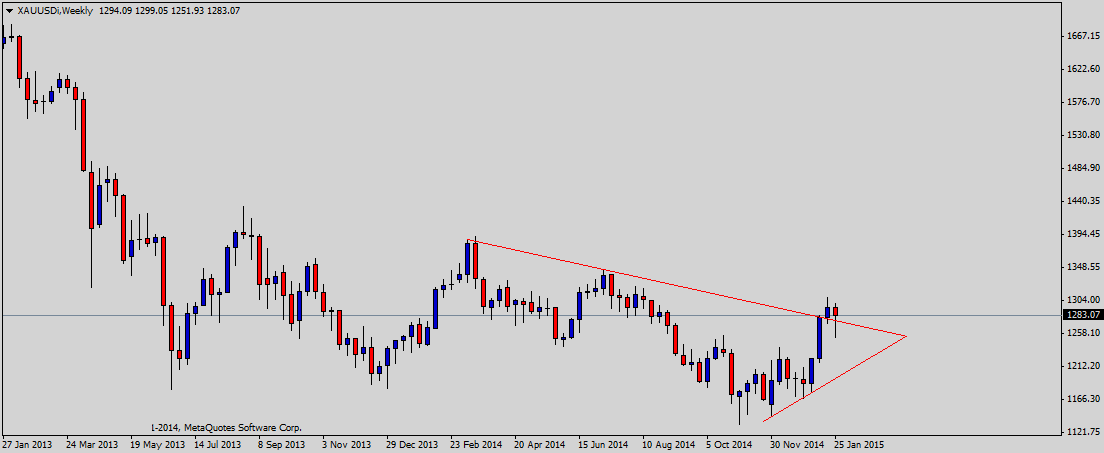
When the price tests trendline then there can be two options, either the price bounces back or it will break the trendline. The breakout is considered an indication for continuity in trend while the pullback signals reversal in the ongoing trend.
Fibonacci Levels
The use of Fibonacci ratios is also very famous among price action traders in order to calculate major support/resistance levels. Key Fibonacci ratios include 0%, 23.6%, 38.2%, 50%, 61.8%, 76.4%, 100%, 161.8% and 261.8% as demonstrated in the following weekly chart of gold.
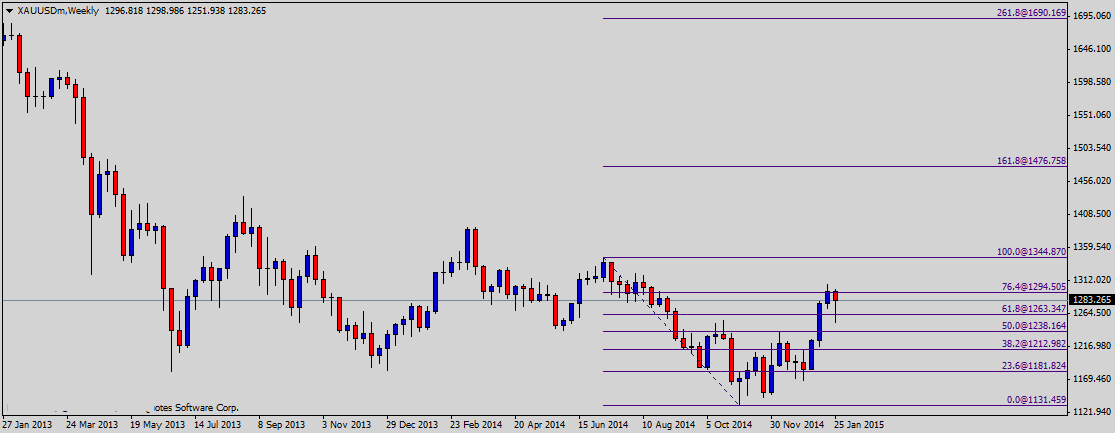
Traders generally use Fibonacci ratios in conjunction with other price action tools.
Candlestick Pattern
Candlestick pattern is another very famous price action strategy in forex trading. Traders use candlestick for a signal of reversal or continuity in the existing trend. In a bullish trend, some bearish candles such as bearish pin bar, bearish engulfing candle or shooting star hint at major bearish reversal. Similarly in a bearish trend, bullish candles such as bullish pin bar, hammer or bullish engulfing signal major bullish reversal in short term.
Horizontal levels
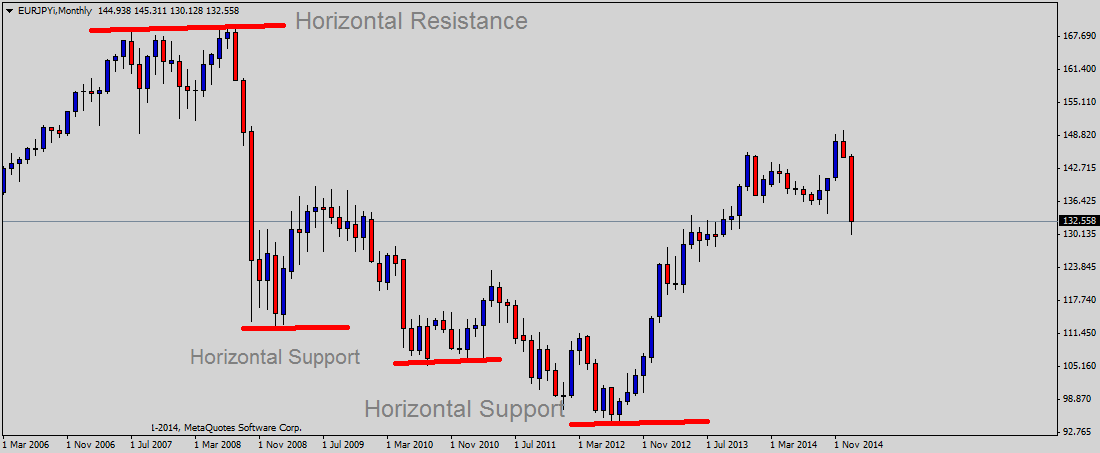
Identifying support and resistance with the help of horizontal levels is another famous price action tool. As demonstrated in the following chart, horizontal support consists of levels that acted as support level somewhere in the past. Likewise, horizontal resistance consists of levels that acted as resistance in the past.
This was a brief account on various tools of price action analysis. Using the combination of price action tools is always good to optimize the results. Price action analysis is generally considered reliable on four-hour and higher timeframes.
This article represents the opinion of the Companies operating under the FXOpen brand only. It is not to be construed as an offer, solicitation, or recommendation with respect to products and services provided by the Companies operating under the FXOpen brand, nor is it to be considered financial advice.
Latest articles

Weekly Market Wrap With Gary Thomson: UK100, USD, GOLD, OIL
Get the latest scoop on the week's hottest headlines, all in one convenient video. Join Gary Thomson, the COO of FXOpen UK, as he breaks down the most significant news reports and shares his expert insights.
- UK100 Share Index Rises

What Is a Darvas Box Theory and How Does It Work in Trading?
The Darvas Box Theory, pioneered by Nicolas Darvas in the 1950s, has transcended its stock market origins to become a valuable tool for forex traders. This method leverages specific price movements and patterns, known as the Darvas Box, to track

NFLX Stock Price Falls Despite Subscriber Growth
Yesterday, after the close of the main trading session on the stock market, Netflix reported to investors for the 1st quarter of 2024.
The report turned out better than expected:
→ earnings per share: actual = USD 5.28, forecast = USD 4.