


FXOpen
LTC/USD
Last Thursday the price of Litecoin was $39.8. From there it started falling down fast as it came from $39,75 to $32,72 at the lowest point on the same day, which is a drop of 17.5%. The price continued its downward trajectory and reached $32.5 on Friday, but the price stabilized around $32.48 level over the weekend and even started increasing on Sunday when it came up to $33.426. But more movement to the downside has been made from there as the price came down to $30.47 on Monday.
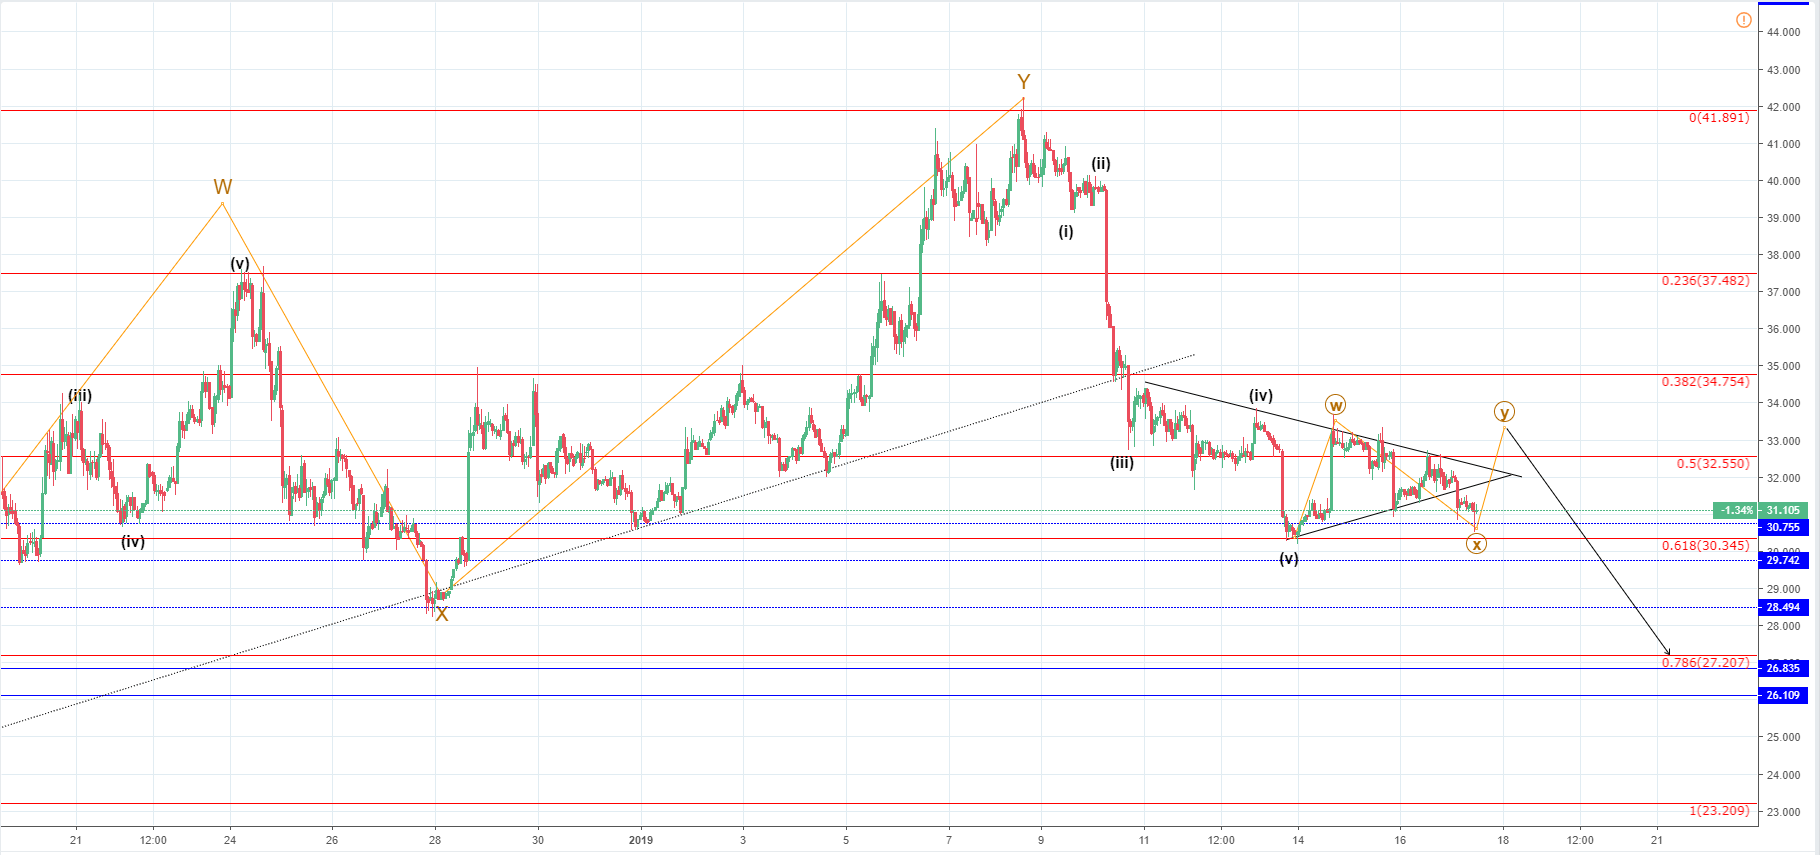
From there on the price has started increasing and came up by 9.76% as it reached $33.366 slightly above the 0.5 Fibonacci level. But since it also came to the minor downtrends resistance it started decreasing again. Hence, the sellers pushed the price back below the 0.5 Fibo level again with a struggle at first. Then the sellers showed more determination as a large 5% red candle occurred, which is only 2% lower from the previous green one to the upside.
Since then the price has attempted another breakout as a minor uptrend was established. But the momentum wasn’t strong enough for the price to break both the 0.5 Fibonacci level and the downtrends resistance as they have perfectly intersected where the price attempted to cross. Since then more movement to the downside has been seen, and a breakout from the minor uptrend support line and the price went to $30.5 but only for a few minutes, as the buyers immediately pushed the price back past the $31 level.
Looking at my Elliott Wave projection, you can see that I am expecting another increase from here followed by another downtrend. This is because my Elliott Wave count implies that the current triangle-like structure is consolidative in nature and is a correction before further downside. From this Monday the price action movement is most likely in its second stage, which if a three-wave correction will go on for another increase as the third Y wave should develop.
After the correction ends, and I don’t believe that it will go further than the ending point of the wave W or around $33.32, although it might if it gets prolonged by two more waves, we are likely going to see another move approximately the same length as like the previous one. So I have pointed at the 0.786 Fibonacci level for the price target but I would be expecting it to go further down.
EOS/USD
Since Monday when the price fell to $2.26 at it’s lowest point from the prior downtrend move, the price has started increasing with strong momentum as it came up by 11.45% to $2.52. From there as the price encountered strong resistance a retracement occurred as the price is currently sitting at $2.447.
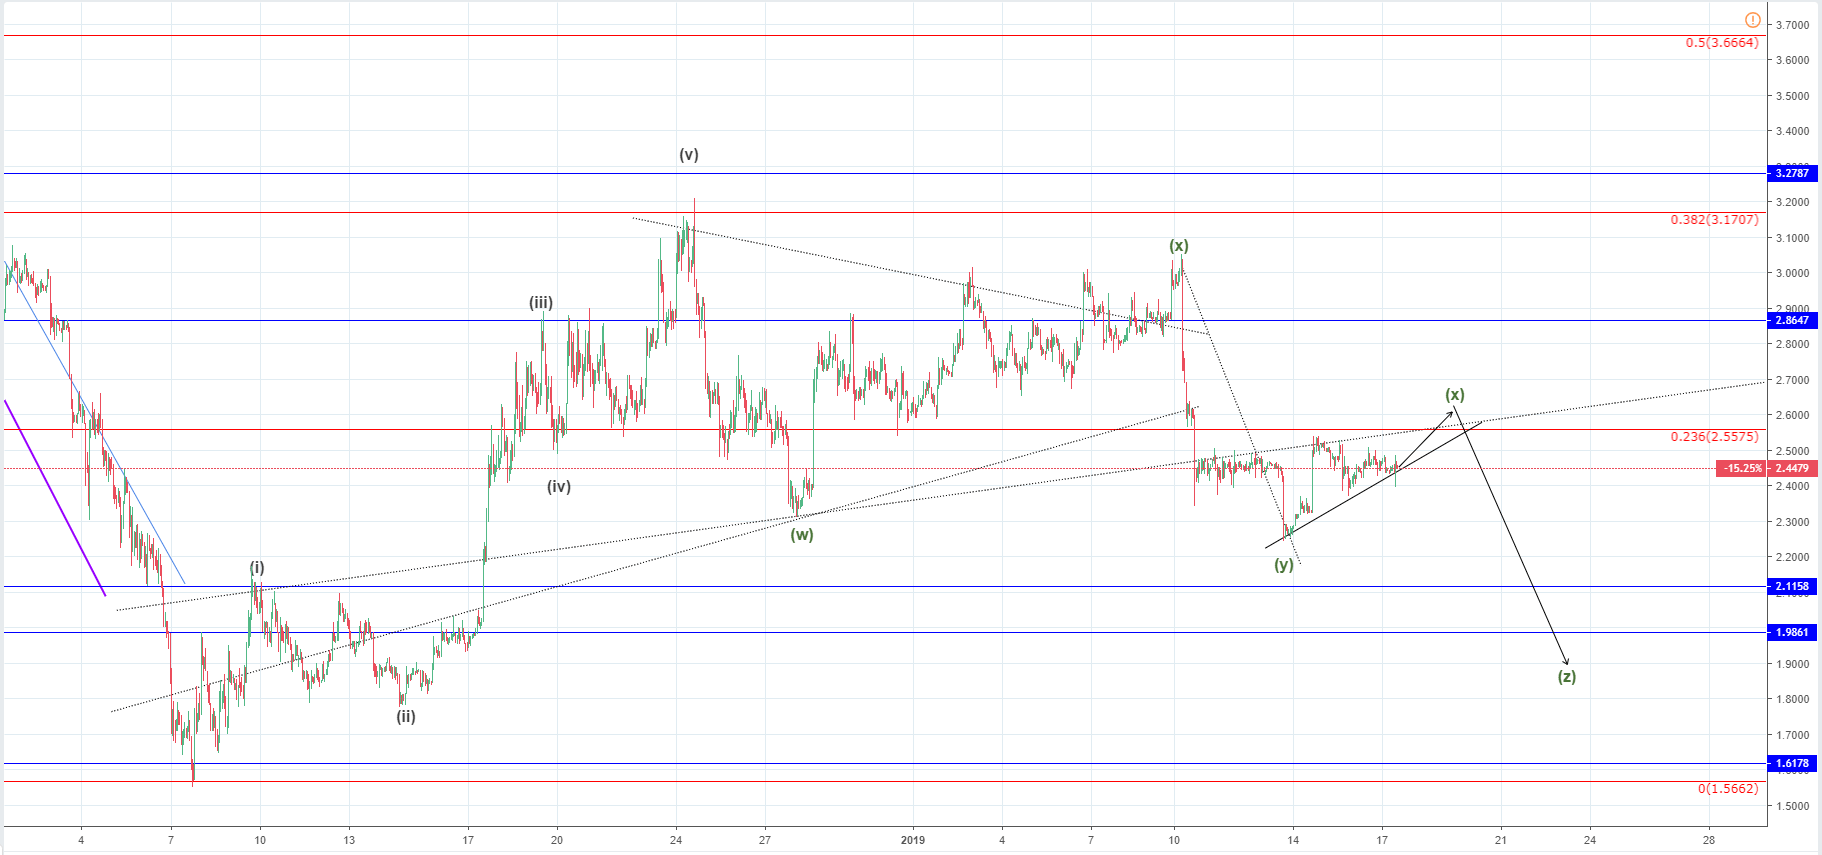
Looking at the hourly chart, you can see a similar projection like in the case of Litecoin as the market is strongly correlated. The current upward movement has formed an ascending wedge, which is most likely going to end as a breakout to the downside with further downtrend continuation as it is definitely corrective in nature. The impulsive move to the downside that we have seen last week is the third wave Y, which means that the ascending wedge structure is the 4th wave X, and is the reason why more downside should be expected as the 5th wave Z to the downside is most likely going to start after one more minor increase.
The target for the expected minor increase would be around the 0.236 Fibonacci level or at where the most significant resistance is. After it ends the wave Z should start, which will lead the price down and the first target for its ending point would be on the next horizontal support area from $2.11-$1.94.
FXOpen offers the world's most popular cryptocurrency CFDs*, including Bitcoin and Ethereum. Floating spreads, 1:2 leverage — at your service. Open your trading account now or learn more about crypto CFD trading with FXOpen.
*At FXOpen UK and FXOpen AU, Cryptocurrency CFDs are only available for trading by those clients categorised as Professional clients under FCA Rules and Professional clients under ASIC Rules respectively. They are not available for trading by Retail clients.
This article represents the opinion of the Companies operating under the FXOpen brand only. It is not to be construed as an offer, solicitation, or recommendation with respect to products and services provided by the Companies operating under the FXOpen brand, nor is it to be considered financial advice.
Latest articles

AUD/USD Analysis: Aussie Weakens After RBA Decision
Following its decision on 7th May, the Reserve Bank of Australia (RBA) opted to maintain the interest rate at 4.35%, despite inflation continuing to decrease at a slower pace than anticipated by the RBA.
"I think we still think

The Hang Seng Index Has Risen by Over 13% in 2 Weeks
Analyzing the Hang Seng (Hong Kong 50 at FXOpen) chart, we wrote on January 30th that the price was near an important support level formed by the lower boundary (shown in orange) of a long-term channel, which has been relevant

Turtle Trading: System, Rules, and Strategy
In the 1980s, the Turtle Trading system was born from a debate about whether trading skills were innate or could be taught. Richard Dennis and William Eckhardt decided to train novices in their trend-following trading strategies, thus giving rise to