


FXOpen
LTC/USD
From Monday’s spike at $62 the price of Litecoin has retraced by 11.8% as its currently trading at $54.73.
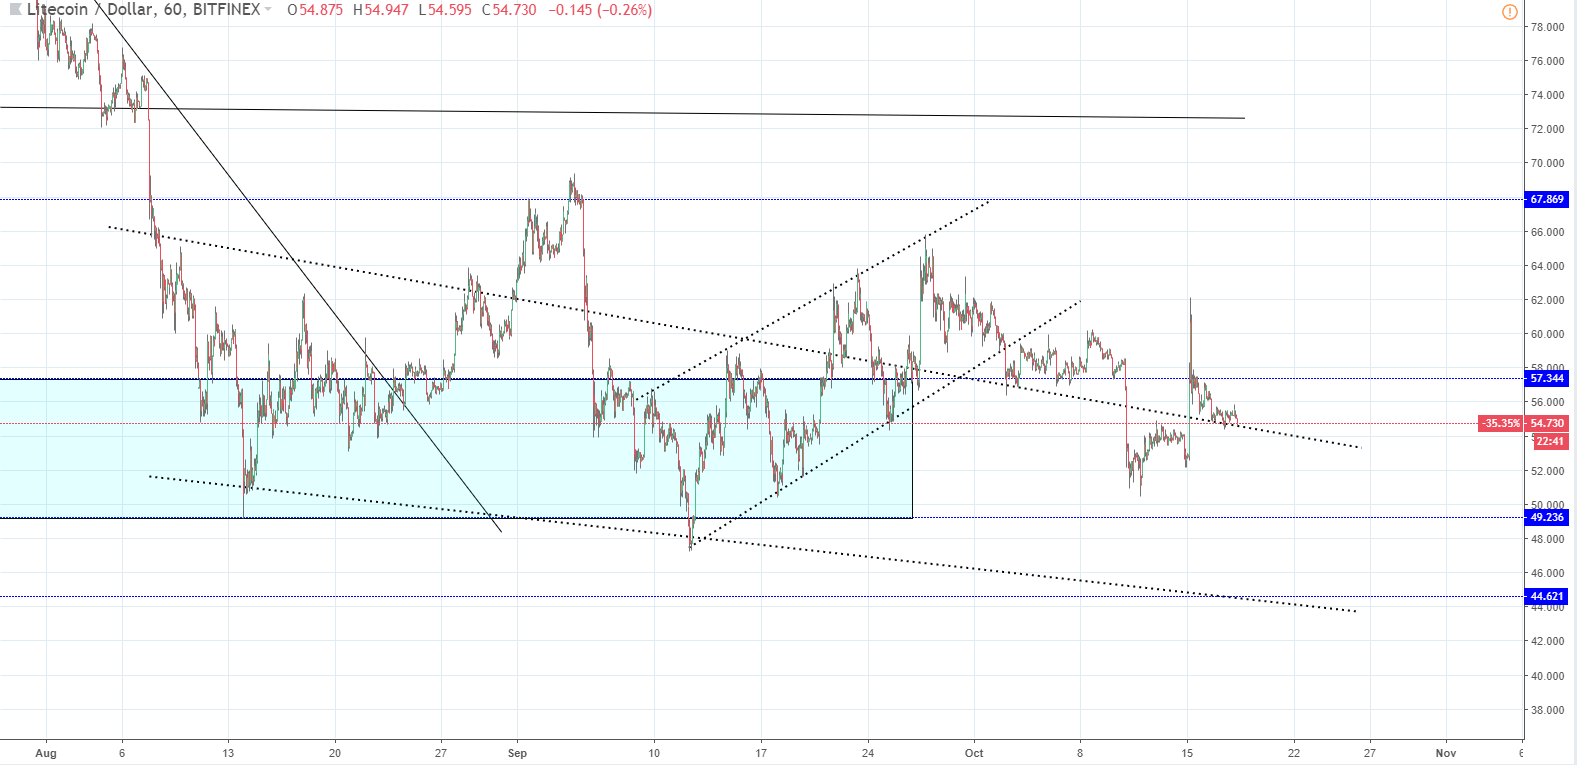
Looking at the hourly chart we can see that the price action is now back on the descending channels resistance line, which now serves as a support. As you can see, the price action formed an ascending channel that breaks out from the descending one. But it results in a painful and slow upward move followed by a massive red candle bringing the price back inside the territory of the descending channel. It happened on Monday and happened two more times previously. I believe that this will happen this time as well and the price is heading down to the lower support zone line at $49.2 or even lower to the support zone lower line 2 at $44.62.
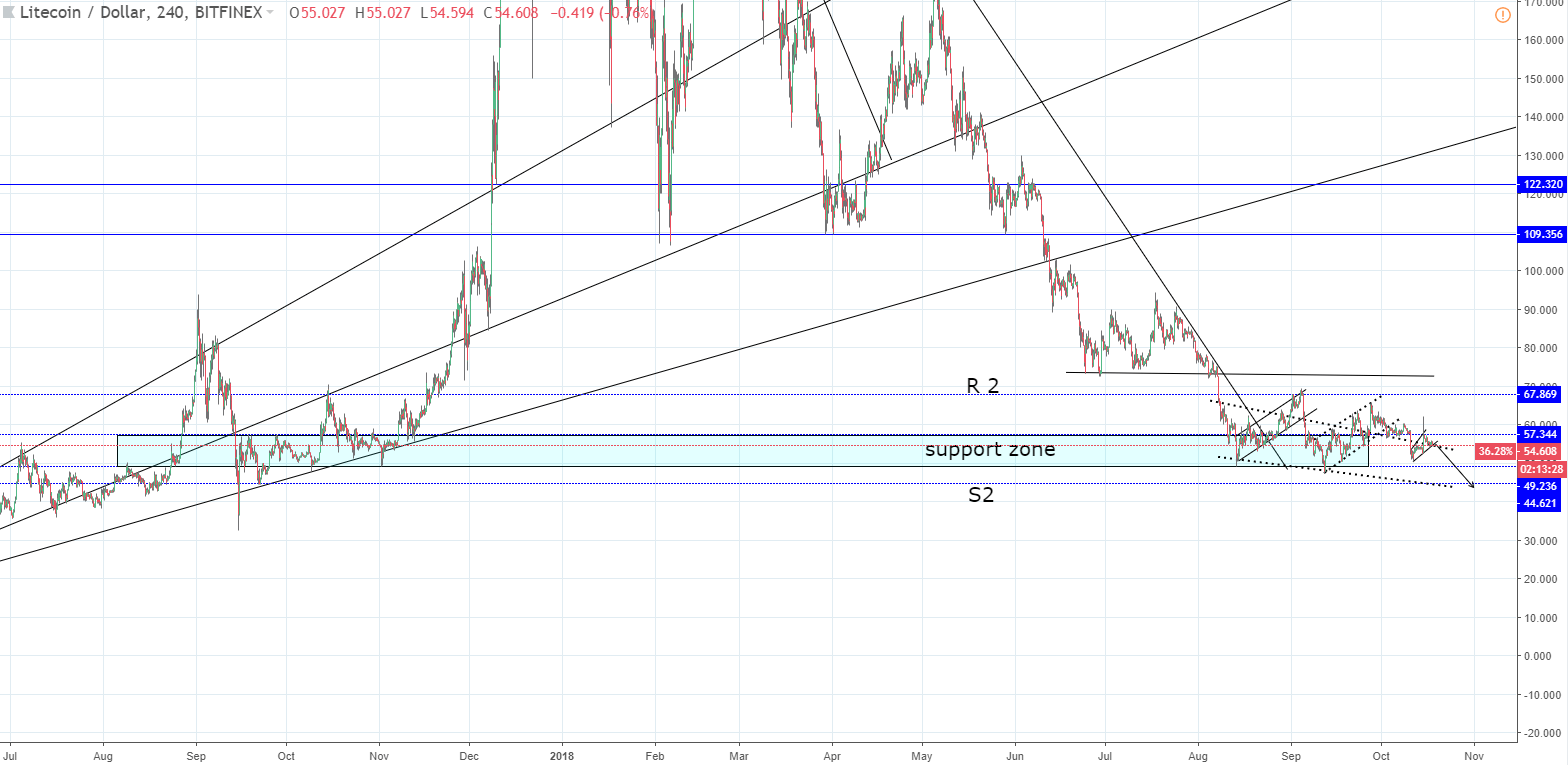
Zooming out on to the 4-hour chart you can clearly see where these significant horizontal levels originate from, and that zone was the main plateau from which the all-time high was made. It would be very significant to break it as it serves as a strong support and was well respected in the past. The price hasn’t gone below it since August last year.
Elliott Wave Projection
Looking at the daily chart below you can see the Elliott Wave labelings. As you can see after a WXY move, which pushed the price to the first lower level of the support zone, an ABCDE correction has developed. This is this current cluster around the support zone.
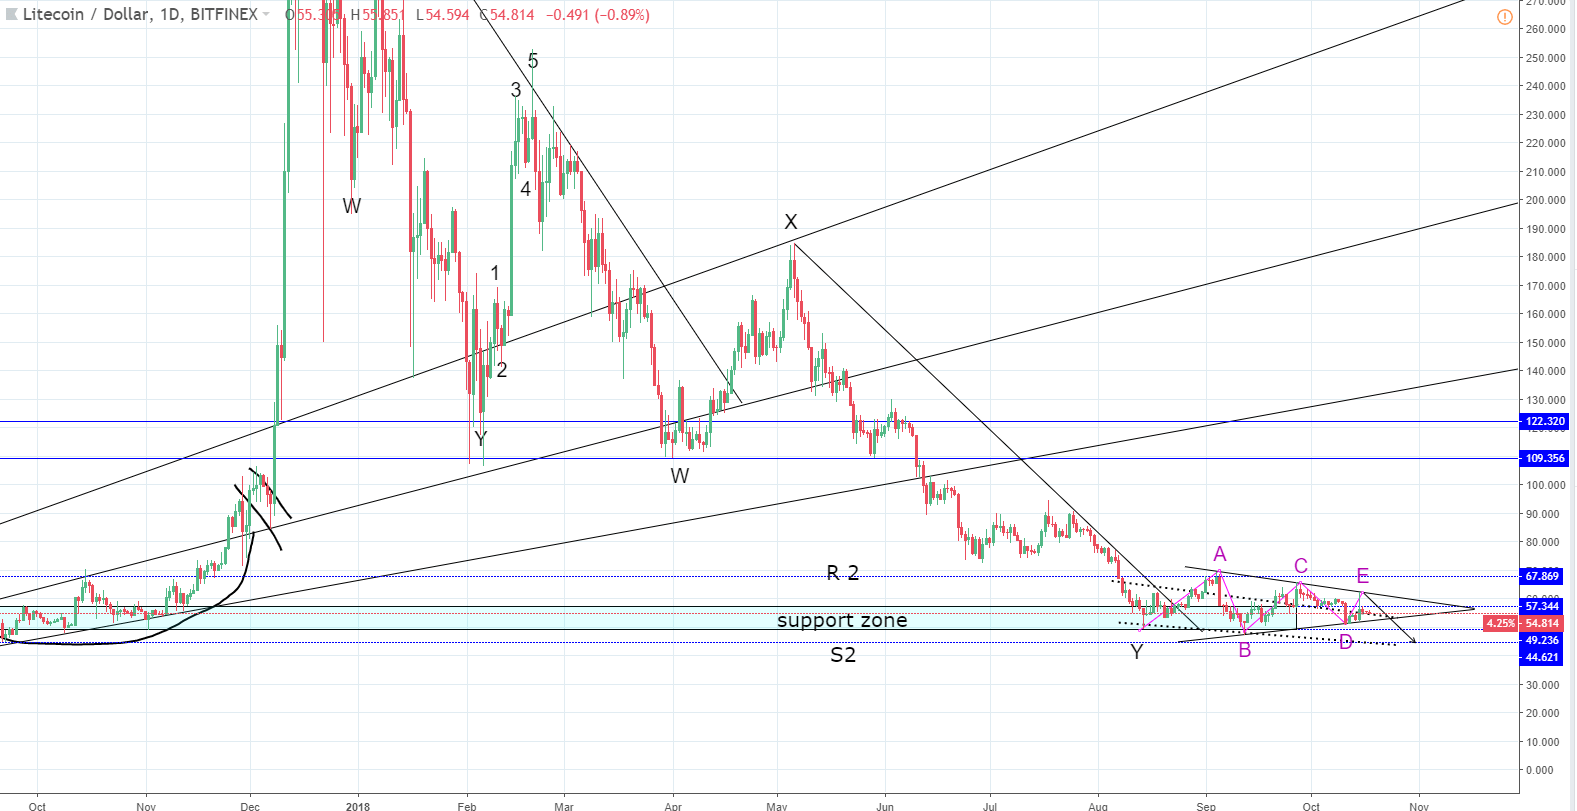
As the E wave ends on the resistance line, more downside is expected at least to the S2 of the support zone or potentially a breakout from it and even a lower target below $44.
EOS/USD
From the levels of Monday’s spike at $6 the price of Eos has fallen by 8.86% and is currently trading at $5.55.
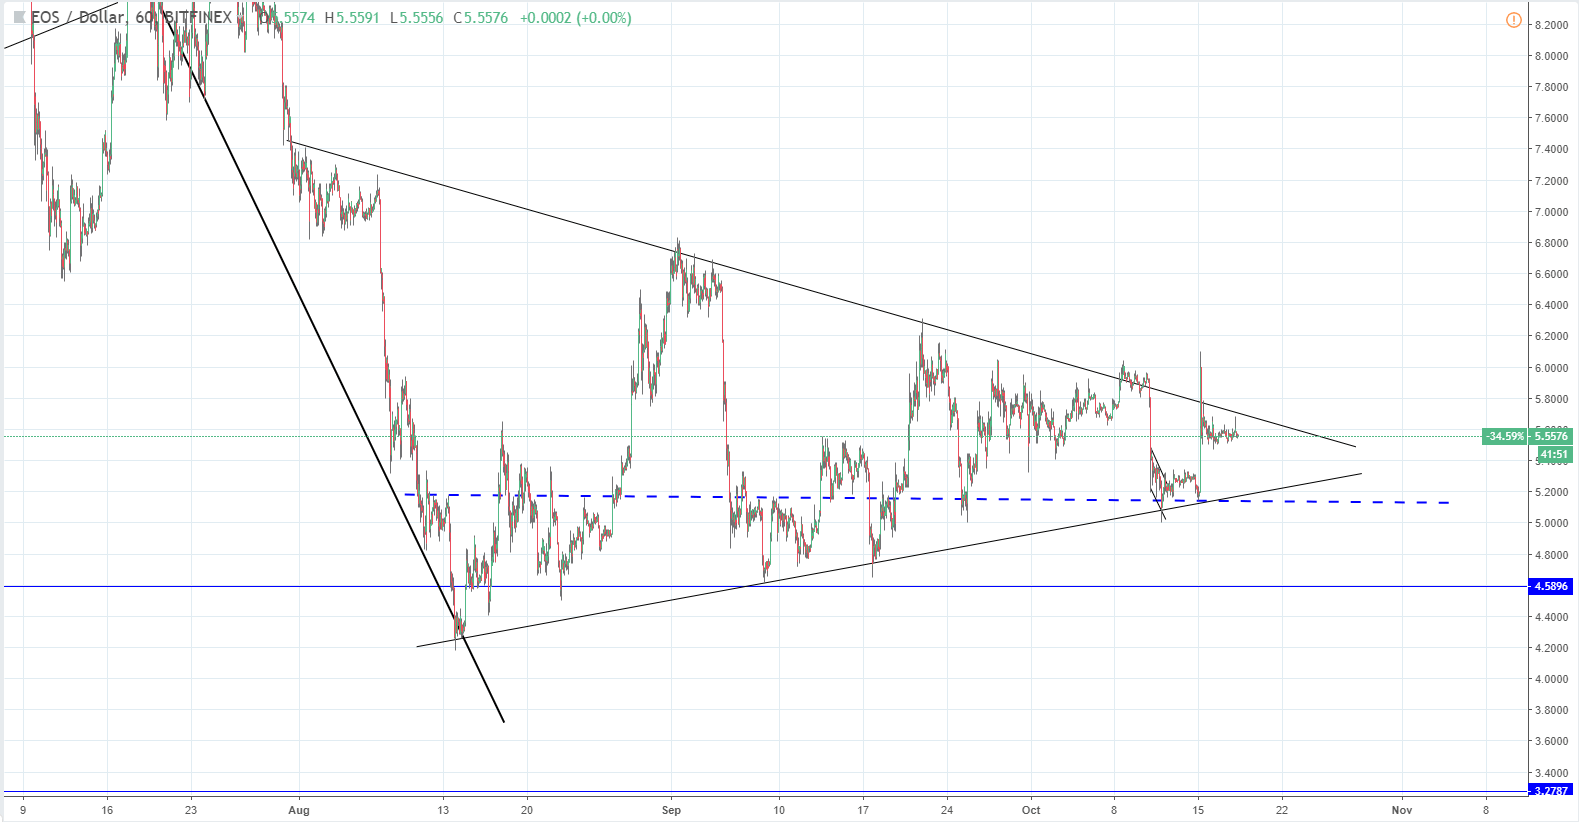
Looking at the hourly chart we can see a similar chart pattern to that of Litecoin – a bearish pennant. The price action is currently below its resistance line while the spike on Monday was above it. Sellers have pushed the price back inside the territory of the triangle and the price is hovering around the midpoints of the spike from the horizontal level at $5.15 to the high at $6.08.
Zooming out onto the 4-hour chart we can see that the price has broken out off of the downtrend resistance line prior to the formation of the bearish pennant.
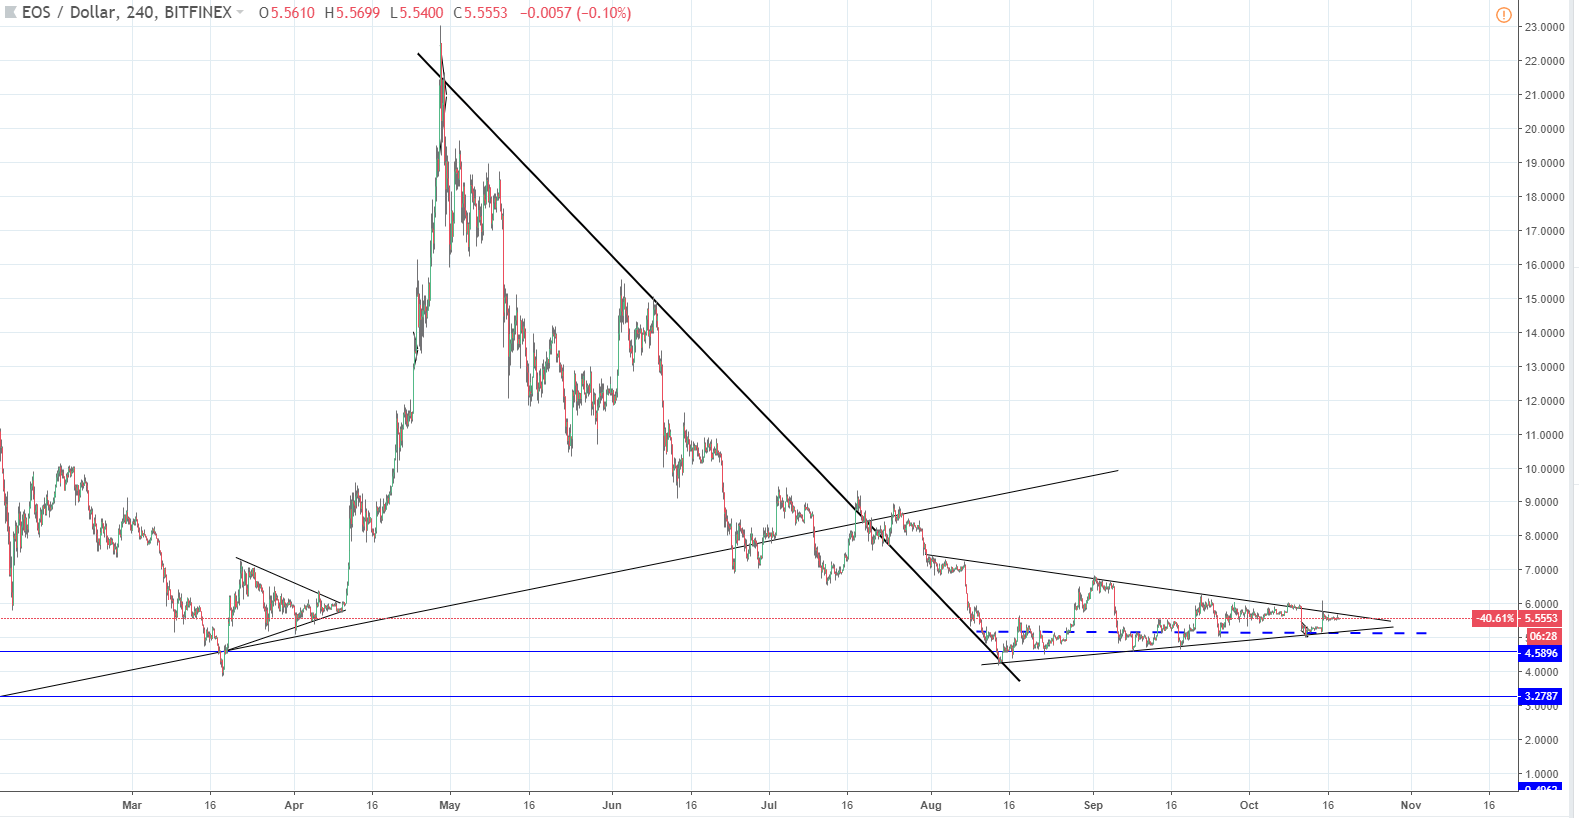
Judging by the momentum behind the selloff the price is heading further lower after this last consolidative triangle. The price might break out from the upside and go to retest the uptrends baseline support, which now serves as resistance but will continue to a lower low afterward in either case.
Elliott Wave Projection
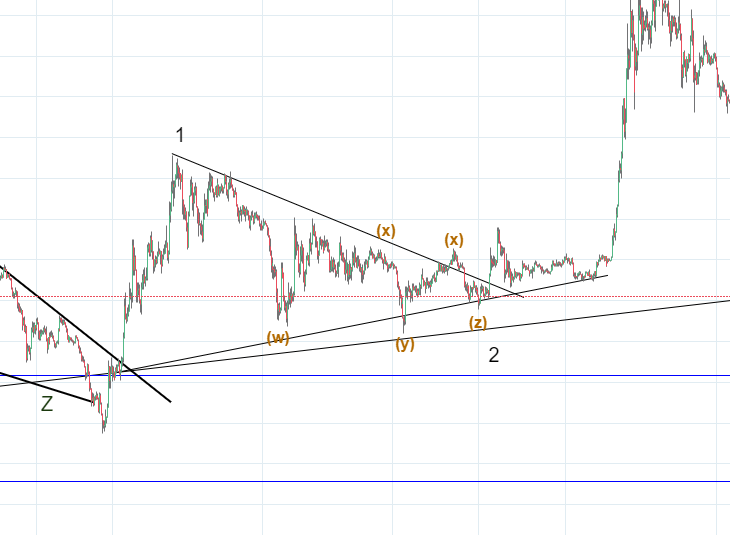
One could argue that the consolidative triangle we are currently seeing will end as a baseline for another increase in price like it did last time in March. But according to my Elliott Wave count, this isn’t the case. Last time we’ve seen a triangle the correction inside it ended on its support and was impulsive.
As you can see from the graph on the left, the correction was a WXYXZ followed by an impulsive move after the Z wave from a higher degree ended previously.
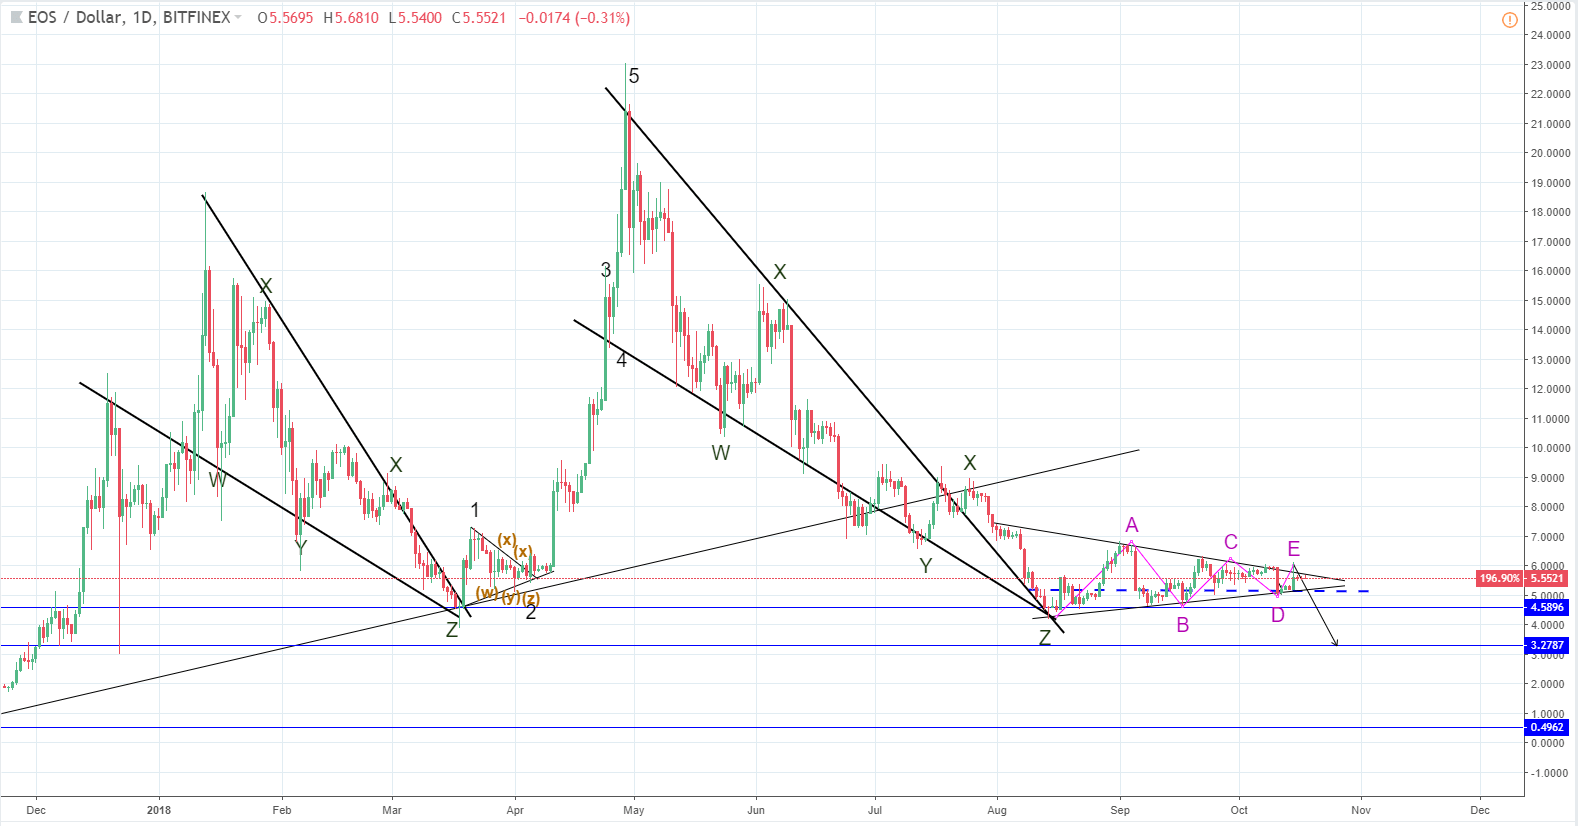
Looking at the daily chart below you can see the Elliott Wave labelings and the price context for the mentioned correction.
The current triangle, which can be interpreted as a bearish pennant, is not corrective after an impulsive move. It is consolidative after the price decreased by 76% from the all-time high. When the price ends consolidating, which is going to happen very soon, a trend continuation will occur pushing the price lower at least around to $4.5. But my target is on the next horizontal support level at $3.27.
Trade altcoins on FXOpen Crypto accounts.
FXOpen offers the world's most popular cryptocurrency CFDs*, including Bitcoin and Ethereum. Floating spreads, 1:2 leverage — at your service. Open your trading account now or learn more about crypto CFD trading with FXOpen.
*At FXOpen UK and FXOpen AU, Cryptocurrency CFDs are only available for trading by those clients categorised as Professional clients under FCA Rules and Professional clients under ASIC Rules respectively. They are not available for trading by Retail clients.
This article represents the opinion of the Companies operating under the FXOpen brand only. It is not to be construed as an offer, solicitation, or recommendation with respect to products and services provided by the Companies operating under the FXOpen brand, nor is it to be considered financial advice.
Latest articles

AUD/USD Analysis: Aussie Weakens After RBA Decision
Following its decision on 7th May, the Reserve Bank of Australia (RBA) opted to maintain the interest rate at 4.35%, despite inflation continuing to decrease at a slower pace than anticipated by the RBA.
"I think we still think

The Hang Seng Index Has Risen by Over 13% in 2 Weeks
Analyzing the Hang Seng (Hong Kong 50 at FXOpen) chart, we wrote on January 30th that the price was near an important support level formed by the lower boundary (shown in orange) of a long-term channel, which has been relevant

Turtle Trading: System, Rules, and Strategy
In the 1980s, the Turtle Trading system was born from a debate about whether trading skills were innate or could be taught. Richard Dennis and William Eckhardt decided to train novices in their trend-following trading strategies, thus giving rise to