


FXOpen
LTC/USD
Over the weekend the price of Litecoin has continued increasing as it came up from Friday’s open at $76.11 to $86.4 at its highest point on Saturday which was an increase of 13.66%. From there as the price increased parabolically we have seen a correctional structure forming which pushed the price for a 12.82% retracement as the price came down to $75.4 at its lowest point today.
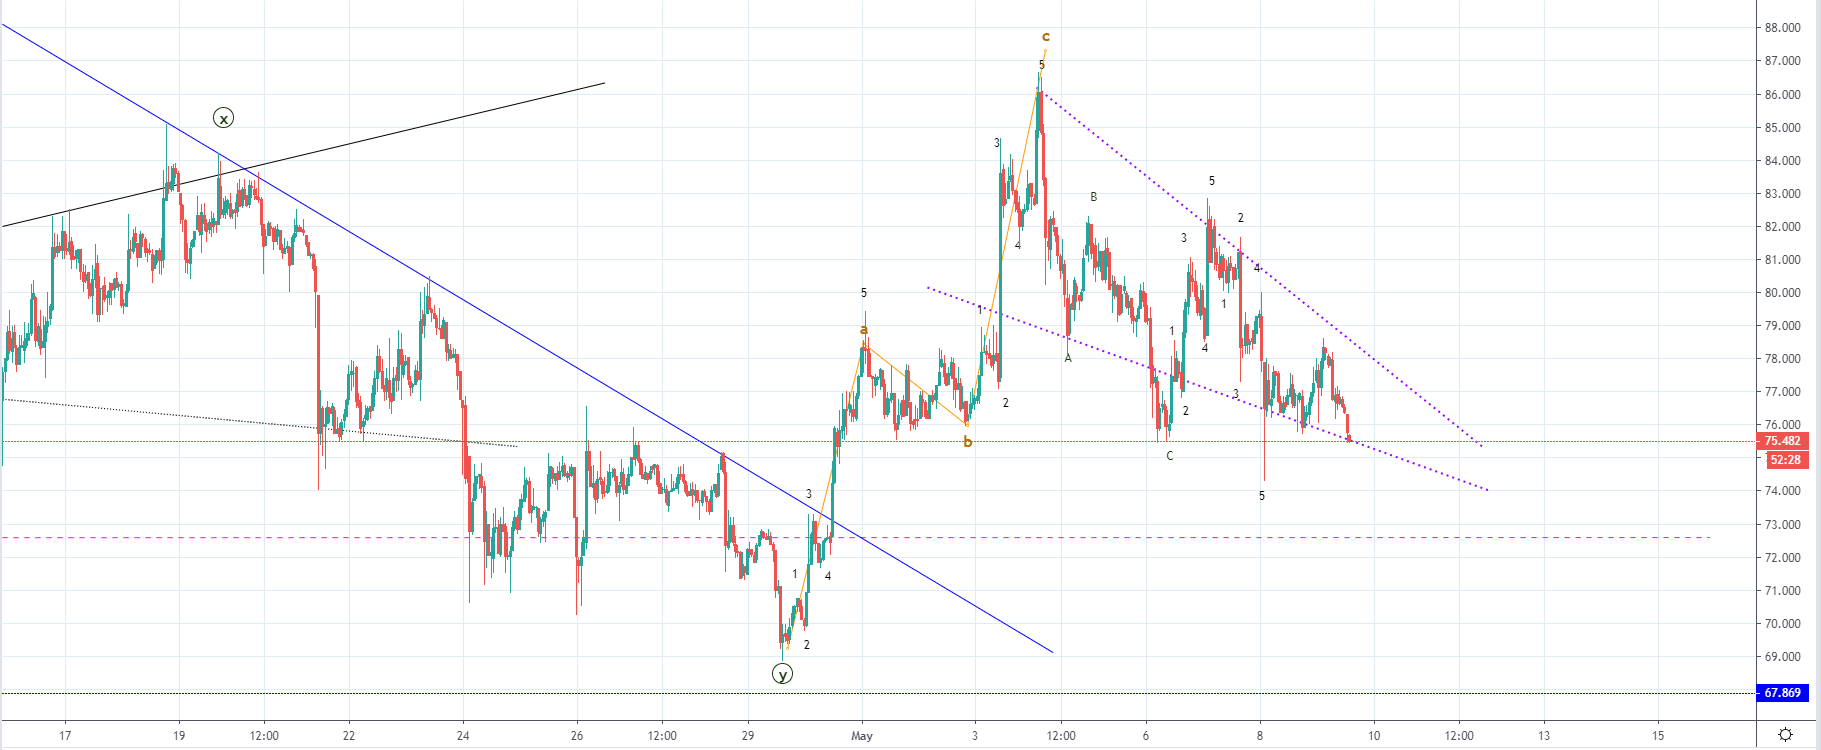
Looking at the hourly chart, you can see that the price of Litecoin came down to its first significant support level from the descending triangle formed by the price action from Saturday’s high. The price previously broke out from the descending structure in which it was correcting since 3rd of April. A breakout occurred as the price moved in a five-wave manner followed by another five-wave increase. This was expected to develop as an impulsive move to the upside of a higher degree but as the price, today fell below the territory of the presumed 2nd wave the outlined scenario has been invalidated.
This is why I have labeled the prior increase as an ABC correction to the upside as I have counted three waves, and now that the correctional structure inside the descending triangle got prolonged by another five-wave move after which another started I think that in the upcoming period we are to see further downside movement for the price of Litecoin as the third correctional structure inside the triangle should develop.
The third correctional structure started developing on Tuesday when the five-wave decrease started developing and has ended as an interaction with the upper descending support. As its completion is awaited another move to the lower descending support from the triangle would be expected which would in price terms be around $72.665 were the minor horizontal support level is.
EOS/USD
The price of EOS has formed a similar structure to the one of Litecoin, as it too reached its high on Saturday from where a descending triangle has started forming. The price came up to $5.4 at its highest point on Saturday and since then it decreased by 9.33% on Monday’s low at $4.9 but made a correctional increase after to $5.3 level but is currently being traded at $4.95 close to the Monday’s low.
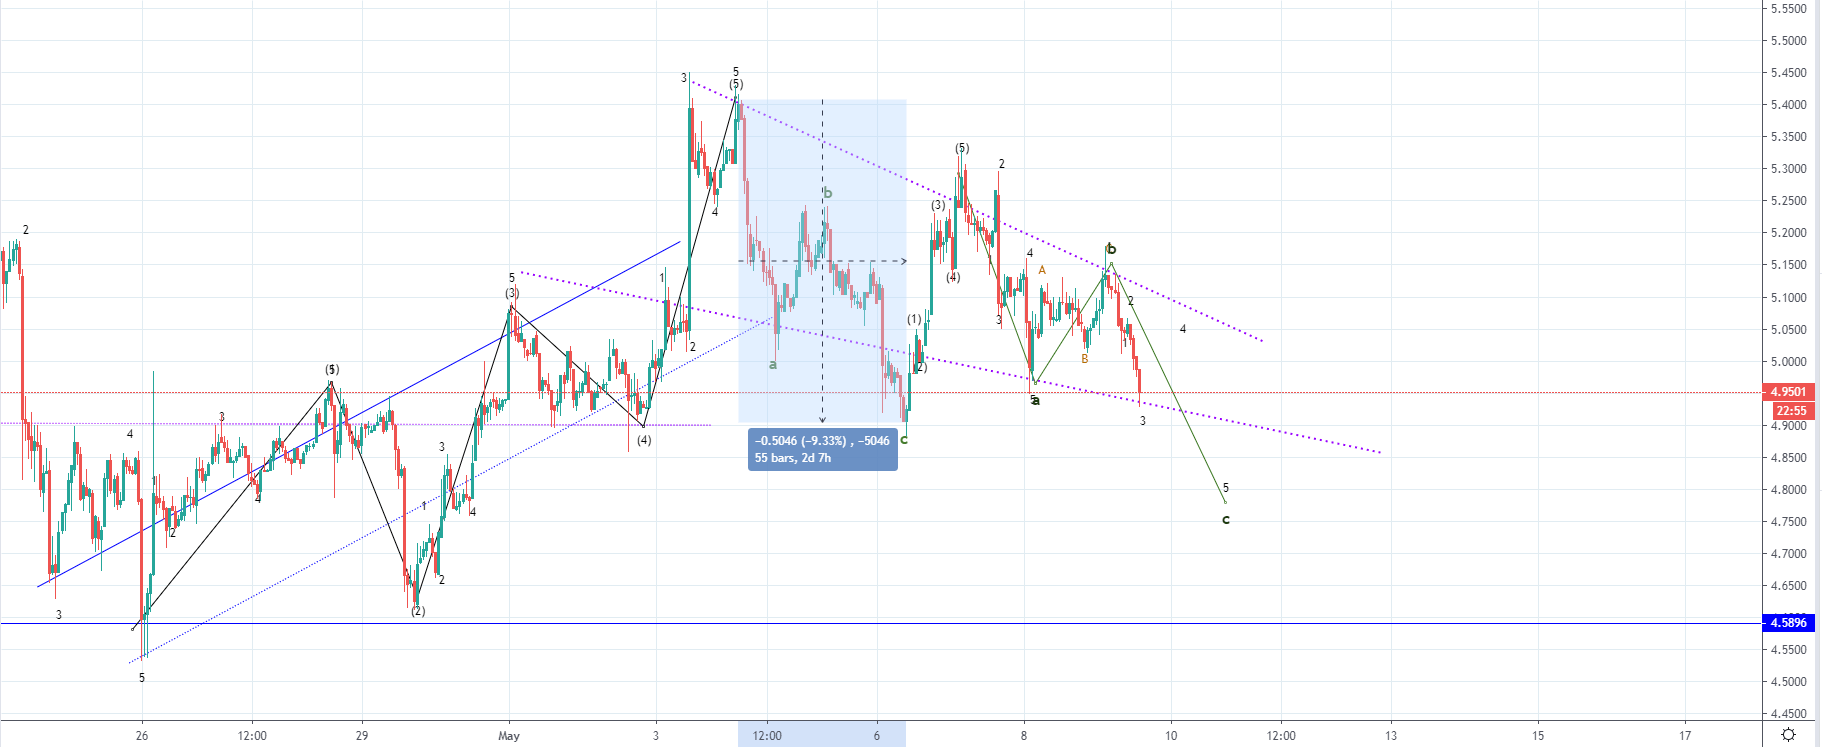
On the hourly chart, we can see that the price of EOS has interacted with its descending support line today where it found support at least for now as indicated by the wick from the downside on the last hourly candle.
As we are seeing a correction developing after an upside move which could be impulsive as I’ve counted five waves. This means that we could be seeing the 2nd wave out of the higher degree impulse wave to the upside which is developing in a three-wave manner. As the last correctional structure is to develop fully, the further downside would be expected from here to $4.8 level which could end as a spike to the downside like we saw on Monday.
After the move to the downside trend continuation would be expected as if we are seeing the development of the 2nd wave the 3rd with the strongest momentum would be expected, but if the upside move from 26th of April until Saturday 4th of May wasn’t impulsive we could be seeing the start of a higher degree move to the downside.
This article represents the opinion of the Companies operating under the FXOpen brand only. It is not to be construed as an offer, solicitation, or recommendation with respect to products and services provided by the Companies operating under the FXOpen brand, nor is it to be considered financial advice.
Latest from Financial Market News
Latest articles

Google Share Price Rose Post-market to a New All-time Record
Yesterday, after the close of the main trading session, a report on activities for the 1st quarter of Alphabet Inc. (Google's parent company) was published. The report was strong, exceeding investors' expectations.
→ Quarterly EPS = USD 1.89 (expected = USD 1.

S&P 500 Rebounds after Negative GDP News
Data released yesterday showed US GDP growth slowed to 1.6% in the first quarter of the year. According to ForexFactory: forecast = 2.2%, past value = 2.4%.
Reaction to the news sent the S&P 500 mini stock

GBP/USD And USD/CAD Daily Chart Outlook
GBP/USD is attempting a recovery wave from 1.2300. USD/CAD is consolidating and might aim for a move above the 1.3760 resistance zone.
Important Takeaways for GBP/USD and USD/CAD Analysis Today
· The British Pound started