


FXOpen
LTC/USD
From last Monday when the price of Litecoin was sitting at $87.72 at its lowest point we have seen an increase of 16.79% as the price came up to $102.45 on this week’s Monday. The price spiked even further to the upside to 107.2 but since it attempted to exceed the prior high and entered the seller’s territory it started decreasing again. Currently, the price is being traded at $90.8 as a retracement occurred.
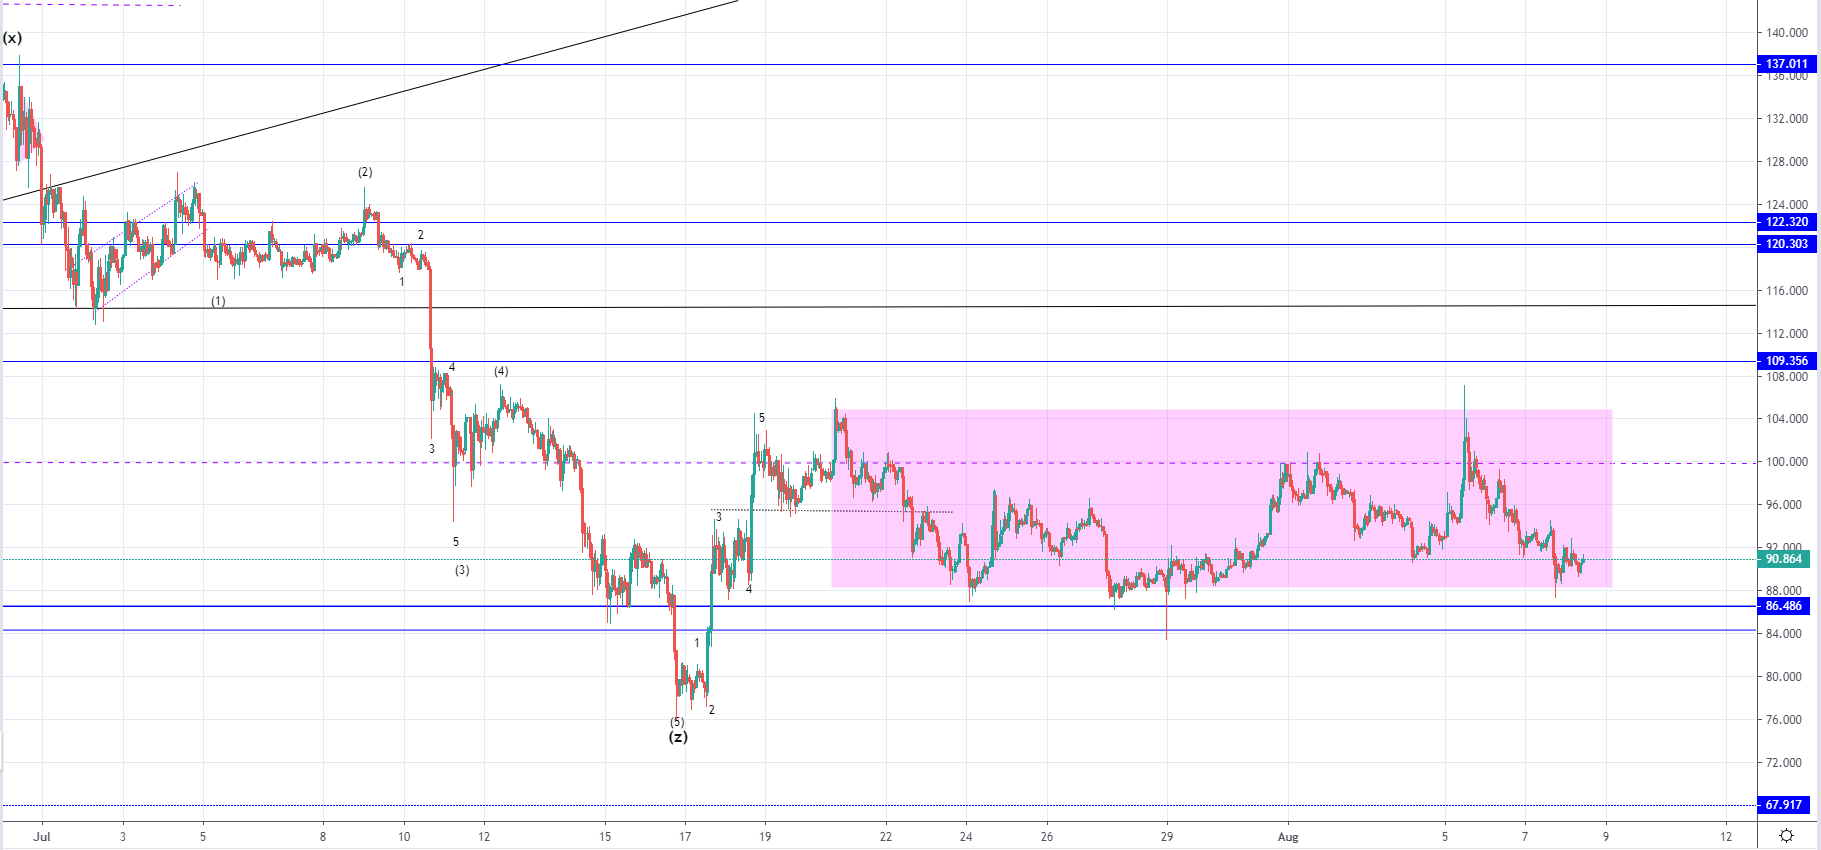 Looking at the hourly chart, you can see that the price is stuck in horizontal range and has been moving sideways since the first attempt for recovery has been made. The price came down below the horizontal support zone at $86.4 but then spiked to $104 in one go. This increase has been made in a five-wave manner which is why it could have been the first wave out of the next impulse wave to the upside, but since the price started moving sideways after a minor retracement this isn’t much likely.
More likely we are seeing another corrective range after a complex correction has ended which could either be a consolidation before a proper recovery or before the downfall continues. This is why from the direction of a breakout from the horizontal range we are most likely going to see an indication of the next move’s direction but for now, a breakout to the downside looks more likely.
EOS/USD
Last Monday the price of EOS was $4.133 end even spiked further to the downside reaching $3.87 at its lowest point but since then has recovered to $4.58 on Monday this week. From Monday the price started decreasing again and came down by 10% on the next day but is currently being traded at $4.187 as it’s retesting its horizontal support level.
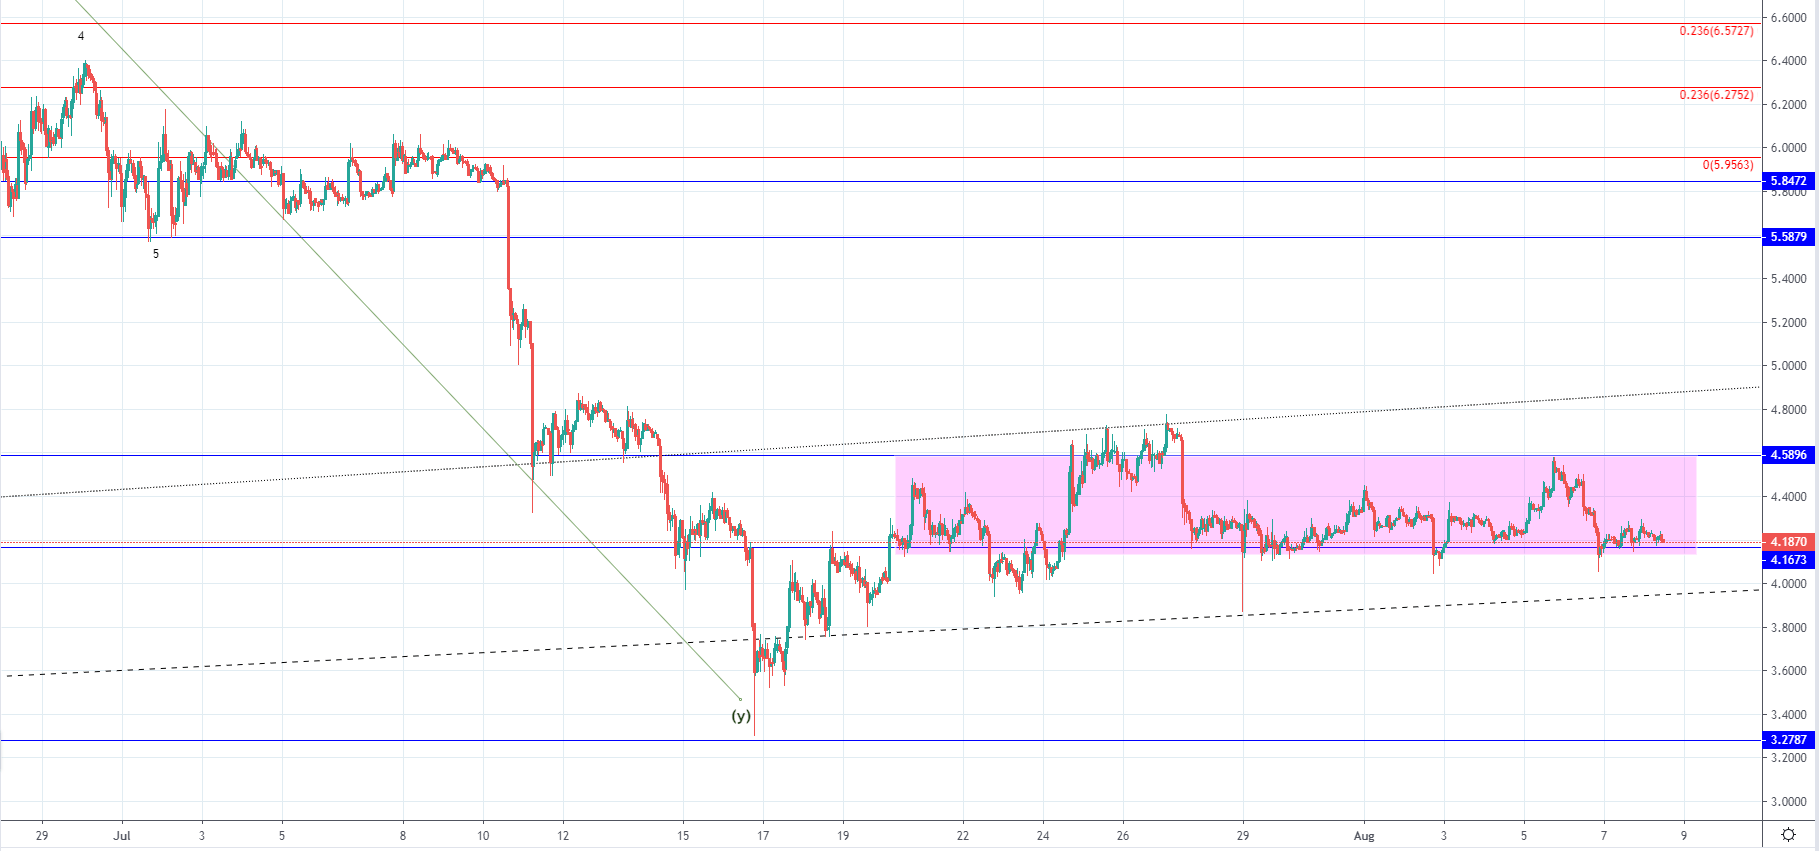 On the hourly chart, you can see that the price is stuck in a horizontal range much like in the case of Litecoin and is moving between the $4.58 and the $4.16. This range has been formed after the price ended its downfall when it came down to $3.6 coming from slightly above $6 which was a decrease of 40.19% which could be interpreted as a consolidative range. The prior downfall was a higher degree correction from the yearly high at $8.63.
As the price decreased in the previous period we might be seeing another attempt of recovery with the horizontal range being the 2nd wave out of the starting five-wave move to the upside, but since it took some time for the price to form the mentioned range it doesn’t look much likely. More likely we are seeing another corrective range after another downfall.
FXOpen offers the world's most popular cryptocurrency CFDs*, including Bitcoin and Ethereum. Floating spreads, 1:2 leverage — at your service. Open your trading account now or learn more about crypto CFD trading with FXOpen.
*At FXOpen UK and FXOpen AU, Cryptocurrency CFDs are only available for trading by those clients categorised as Professional clients under FCA Rules and Professional clients under ASIC Rules respectively. They are not available for trading by Retail clients.
This article represents the opinion of the Companies operating under the FXOpen brand only. It is not to be construed as an offer, solicitation, or recommendation with respect to products and services provided by the Companies operating under the FXOpen brand, nor is it to be considered financial advice.
Latest from Cryptocurrencies
Latest articles

Weekly Market Wrap With Gary Thomson: UK100, USD, GOLD, OIL
Get the latest scoop on the week's hottest headlines, all in one convenient video. Join Gary Thomson, the COO of FXOpen UK, as he breaks down the most significant news reports and shares his expert insights.
- UK100 Share Index Rises

What Is a Darvas Box Theory and How Does It Work in Trading?
The Darvas Box Theory, pioneered by Nicolas Darvas in the 1950s, has transcended its stock market origins to become a valuable tool for forex traders. This method leverages specific price movements and patterns, known as the Darvas Box, to track

NFLX Stock Price Falls Despite Subscriber Growth
Yesterday, after the close of the main trading session on the stock market, Netflix reported to investors for the 1st quarter of 2024.
The report turned out better than expected:
→ earnings per share: actual = USD 5.28, forecast = USD 4.