


FXOpen
LTC/USD
On Monday, the price of Litecoin has been traded at $90.153 at its highest point but soon started decreasing to its significant horizontal support level at $84. As a breakout occurred from the horizontal support zone the price has fallen to $72.92 and spiked even further to $71.13 at its lowest point today which is a decrease of 21% since the start of the week.  On the hourly chart, you can see that the price broke out from the horizontal range in which it was consolidating from 17th of July. As you can see the price is currently slightly lower than it was on after it fell below the horizontal zone previously which indicates further downside potential as a lower low has been made. This downtrend is likely a continuation of the higher degree downside move which started on 12 of June when the price of Litecoin reached $144 at its highest point.
As we’ve seen a breakout to the downside the next horizontal level which could serve as support would be at around $67.9 but the level is only a minor one which is why I don’t believe that we are going to see it holding the downward momentum. More likely this support point is to cause a temporary reversal which would be set to push the price back up for a retest of the broken significant horizontal zone at $84 before the downside movement continues below it to the next significant support zone which is at around $54-52 area.
EOS/USD
From Monday’s high at $4.239 the price of EOS has decreased by 22.12% as it fell to $3.3 at its lowest spike today. The price is currently being traded at around $3.59 as it started to recover but strong seller’s presence has been seen which is why the momentum is likely to continue.
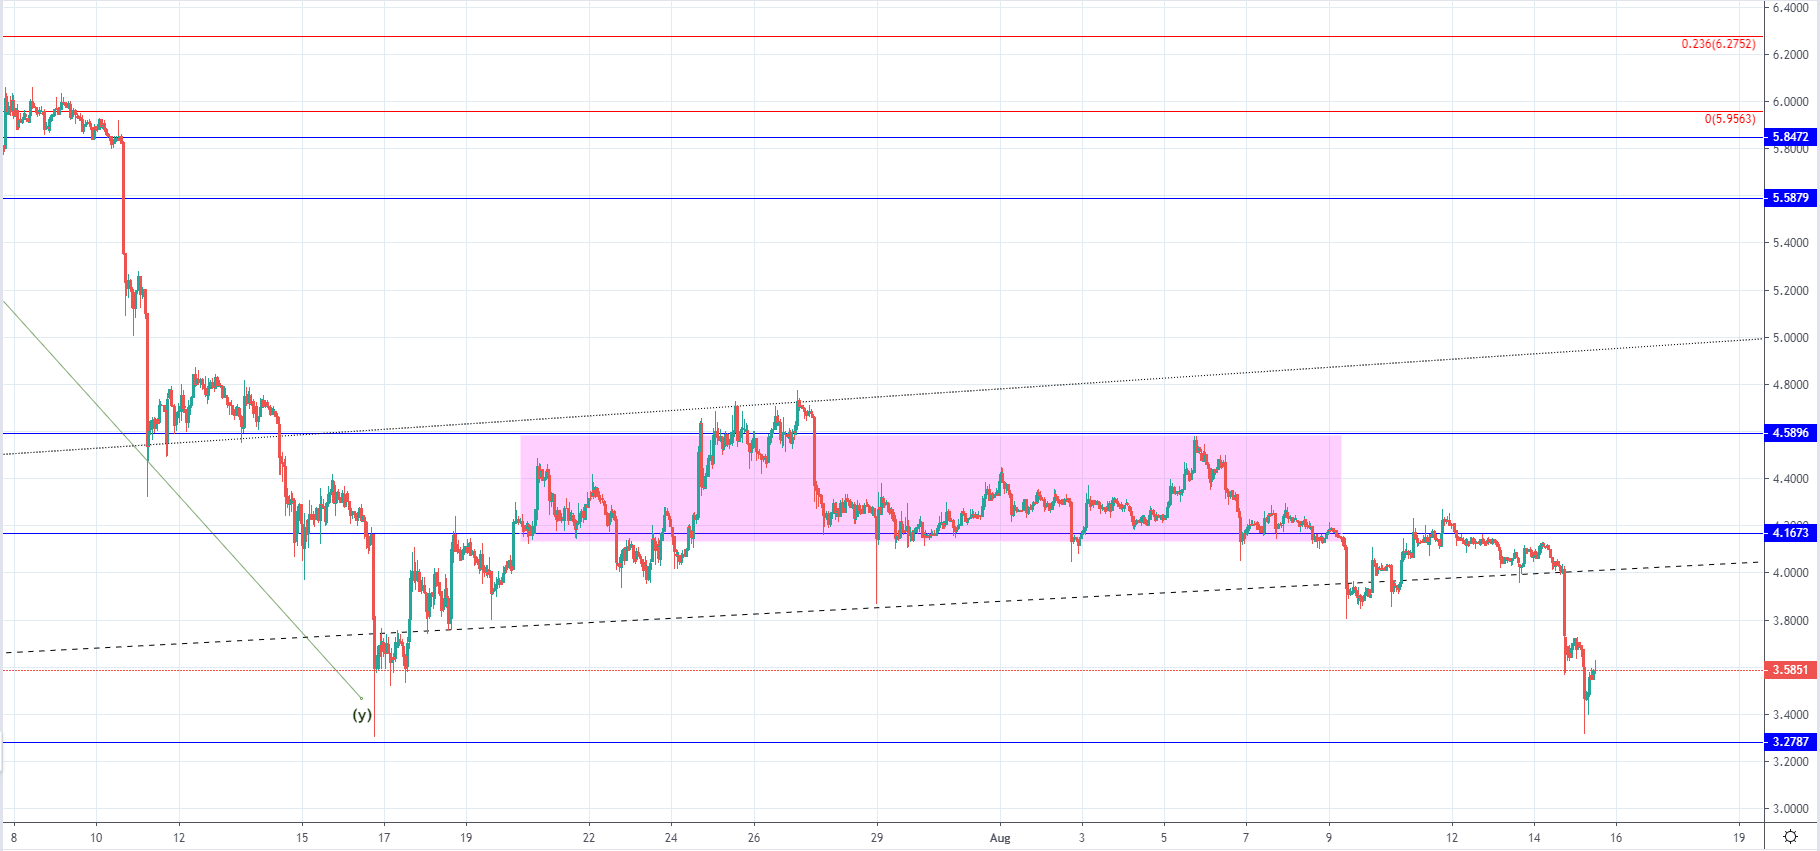 Looking at the hourly chart, you can see that the price broke out from the horizontal range in which it was consolidating from 17th of July but unlike in the case of Litecoin, it hasn’t exceeded the prior low. The hourly candles did close below but the lowest spike has come even slightly higher then the previous one and hasn’t gone below $3.27 horizontal level. Even though the price hasn’t made a lower low we could say that we’ve seen a breakout to the downside as the significant ascending trendline has been broken which is why it is highly likely that the downfall would continue.
The price found some support but this is going to be a temporary one which could set the price for a minor recovery for a retest of the broken support levels for resistance after which another downturn would be seen.
FXOpen offers the world's most popular cryptocurrency CFDs*, including Bitcoin and Ethereum. Floating spreads, 1:2 leverage — at your service. Open your trading account now or learn more about crypto CFD trading with FXOpen.
*At FXOpen UK and FXOpen AU, Cryptocurrency CFDs are only available for trading by those clients categorised as Professional clients under FCA Rules and Professional clients under ASIC Rules respectively. They are not available for trading by Retail clients.
This article represents the opinion of the Companies operating under the FXOpen brand only. It is not to be construed as an offer, solicitation, or recommendation with respect to products and services provided by the Companies operating under the FXOpen brand, nor is it to be considered financial advice.
Latest from Cryptocurrencies
Latest articles

Weekly Market Wrap With Gary Thomson: UK100, USD, GOLD, OIL
Get the latest scoop on the week's hottest headlines, all in one convenient video. Join Gary Thomson, the COO of FXOpen UK, as he breaks down the most significant news reports and shares his expert insights.
- UK100 Share Index Rises

What Is a Darvas Box Theory and How Does It Work in Trading?
The Darvas Box Theory, pioneered by Nicolas Darvas in the 1950s, has transcended its stock market origins to become a valuable tool for forex traders. This method leverages specific price movements and patterns, known as the Darvas Box, to track

NFLX Stock Price Falls Despite Subscriber Growth
Yesterday, after the close of the main trading session on the stock market, Netflix reported to investors for the 1st quarter of 2024.
The report turned out better than expected:
→ earnings per share: actual = USD 5.28, forecast = USD 4.