


FXOpen

LTC/USD
The price of Litecoin has continued increasing since the start of November and has broken out from the symmetrical triangle on the upside. An increase of 11.85% was seen, measured to the highest point made on today’s open which is at $64.32. From there another downturn has started with the price currently being traded at around $61.5 which is a decrease of 4.43%.
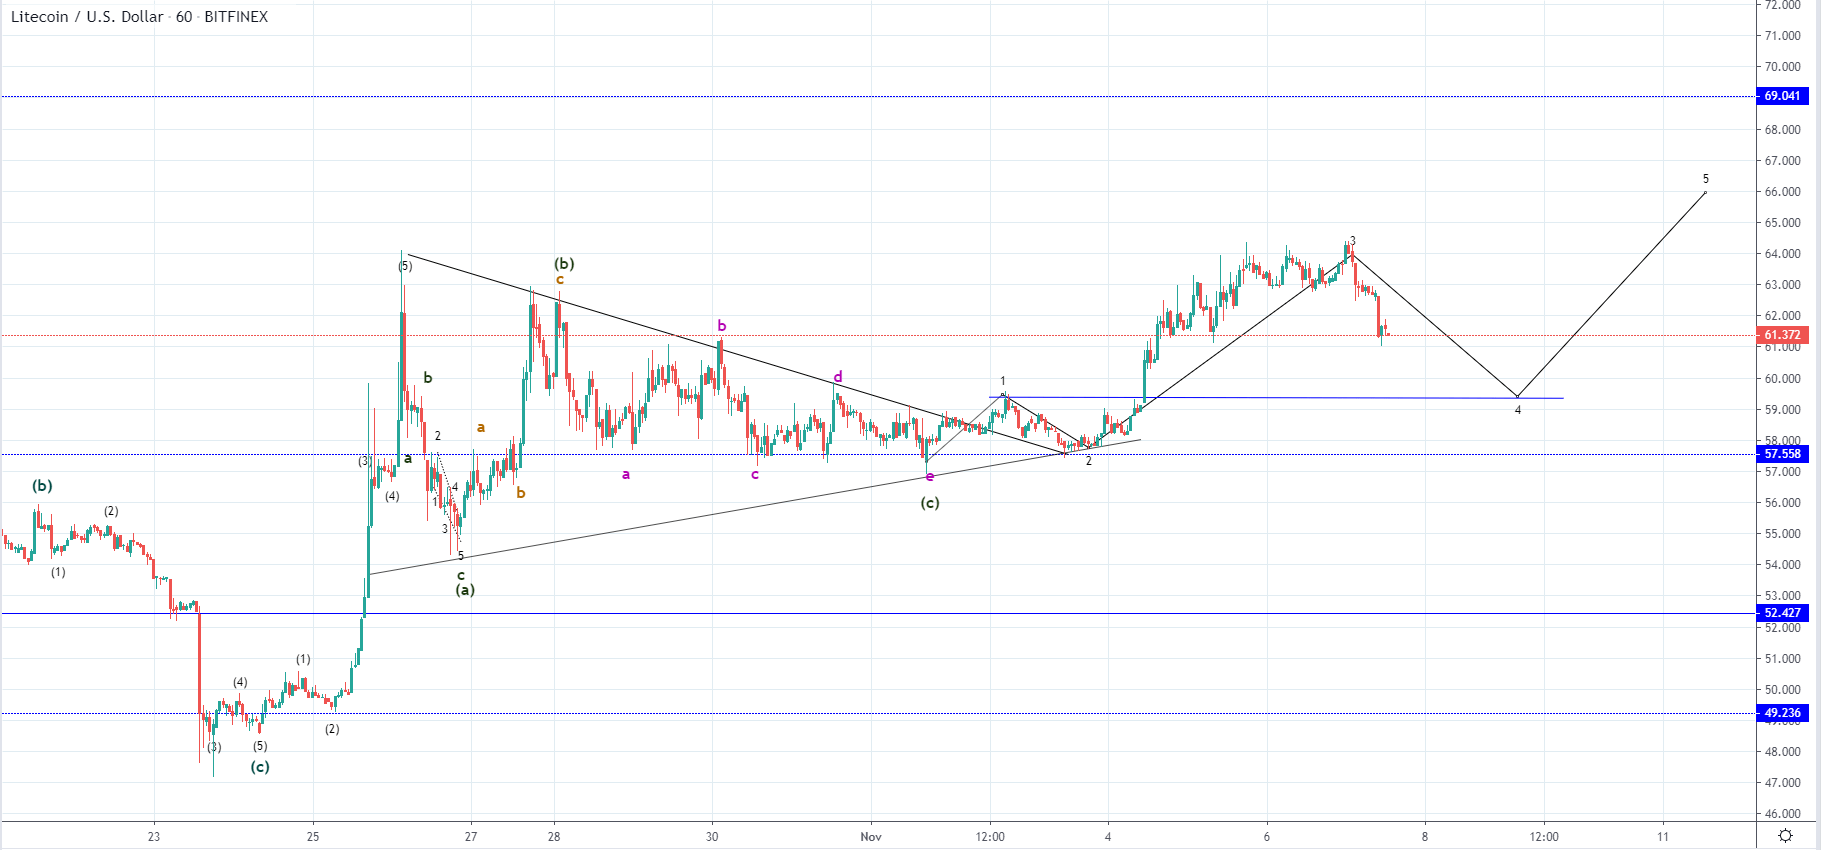
Looking at the hourly chart, you can see that the price of Litecoin undergone a corrective triangle in which we have seen three waves developing an ABC correction. As the price made this triangle after a five-wave move to the upside which looks impulsive in nature the current upside move is most likely its continuation and is likely to develop also in a five-wave manner.
This will be confirmed by the depth of the current downside move which is considered the 4th wave out of the impulsive move the upside which cannot enter the territory of the wave 2 which is at $59.34.
If the price continues moving below the mentioned level the count would be invalidated. In this case, the increase would have ended as a three-wave increase which would be considered corrective in nature and would indicate further downside potential for the price of Litecoin in the upcoming period.
EOS/USD
From the 1st of November when the price of EOS was sitting at around $3.22 we have seen an increase of 13.85% measured to the highest point the price has been yesterday which is at $3.67. Currently, the price is being traded at $3.47 and is still in a downward trajectory, from which similarly like in the case of Litecoin, we are to see if this increase is the start of the next impulsive move to the upside.
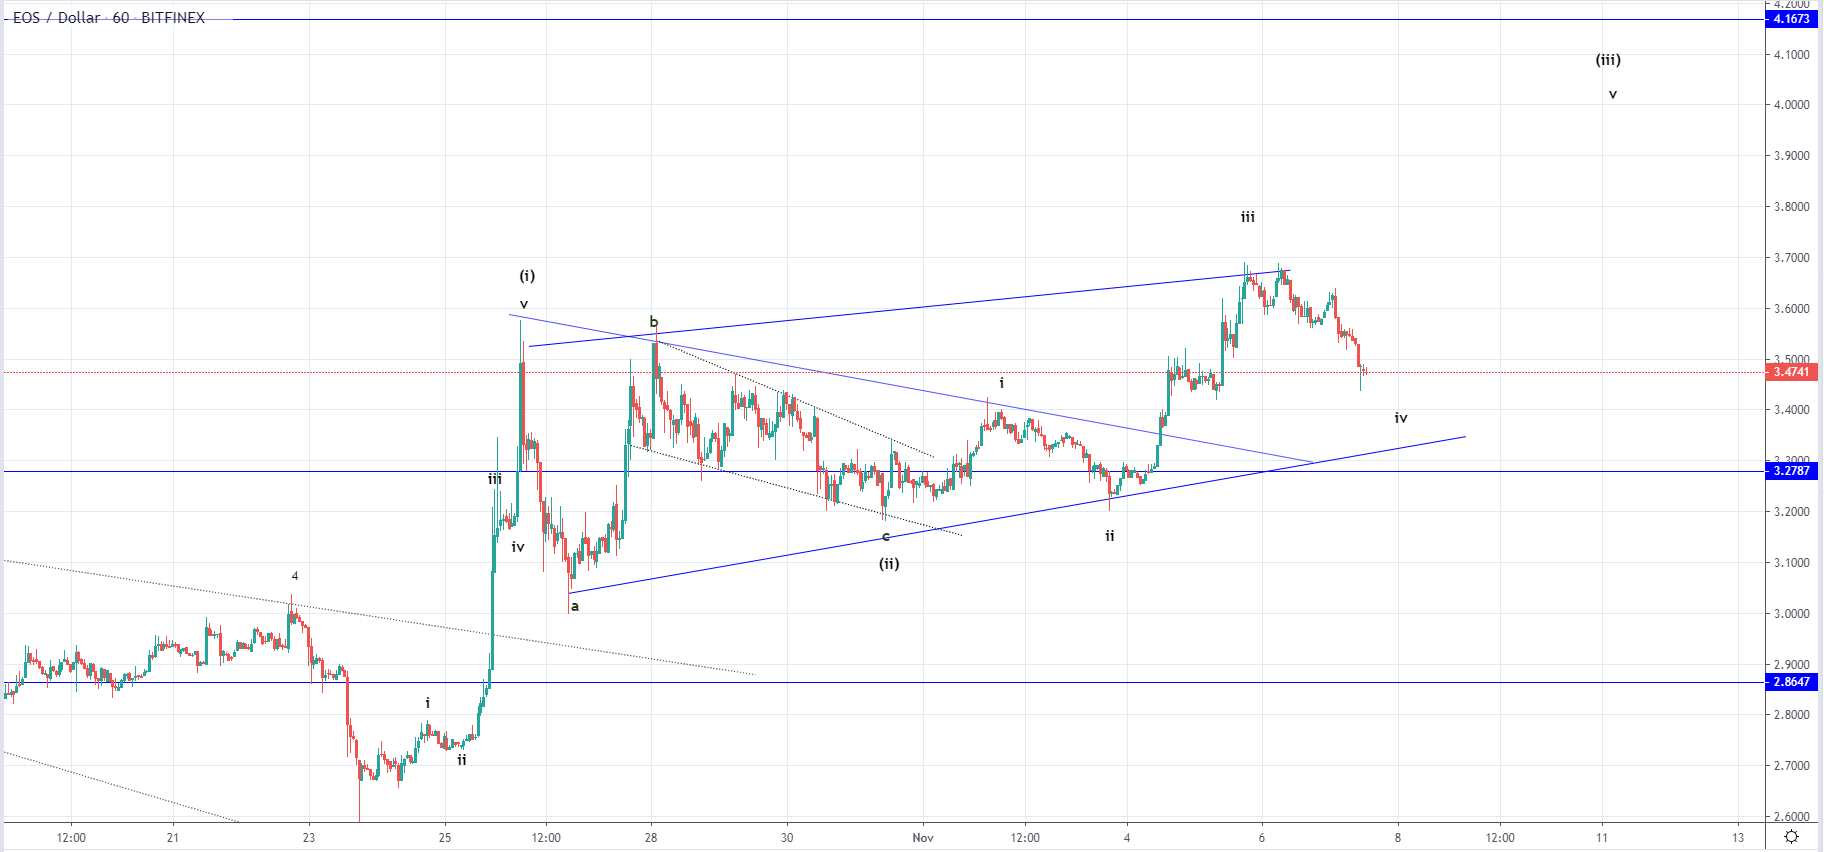 On the hourly chart, we can see that a breakout was made from the triangle in which the price was correcting until the 1st of November, but we haven’t seen a breakout from the ascending channel. Instead, the price interacted with the level and found strong resistance there as the price started an aggressive decline after. This means that we could be seeing the correction’s prolongation which also applies to Litecoin.
The 1st wave’s ending point which is at $3.399 will serve as a pivot point, as if the price continues moving below it, it would invalidate the presumed 12345 count and would point out that increase ended as a three-wave move with another structure to the downside developing before we can see the 3rd wave of the higher degree starting.
FXOpen offers the world's most popular cryptocurrency CFDs*, including Bitcoin and Ethereum. Floating spreads, 1:2 leverage — at your service. Open your trading account now or learn more about crypto CFD trading with FXOpen.
*At FXOpen UK and FXOpen AU, Cryptocurrency CFDs are only available for trading by those clients categorised as Professional clients under FCA Rules and Professional clients under ASIC Rules respectively. They are not available for trading by Retail clients.
This article represents the opinion of the Companies operating under the FXOpen brand only. It is not to be construed as an offer, solicitation, or recommendation with respect to products and services provided by the Companies operating under the FXOpen brand, nor is it to be considered financial advice.
Latest from Cryptocurrencies
Latest articles

Weekly Market Wrap With Gary Thomson: UK100, USD, GOLD, OIL
Get the latest scoop on the week's hottest headlines, all in one convenient video. Join Gary Thomson, the COO of FXOpen UK, as he breaks down the most significant news reports and shares his expert insights.
- UK100 Share Index Rises

What Is a Darvas Box Theory and How Does It Work in Trading?
The Darvas Box Theory, pioneered by Nicolas Darvas in the 1950s, has transcended its stock market origins to become a valuable tool for forex traders. This method leverages specific price movements and patterns, known as the Darvas Box, to track

NFLX Stock Price Falls Despite Subscriber Growth
Yesterday, after the close of the main trading session on the stock market, Netflix reported to investors for the 1st quarter of 2024.
The report turned out better than expected:
→ earnings per share: actual = USD 5.28, forecast = USD 4.