


FXOpen
Belonging to classic technical analysis patterns, double and triple tops and bottoms form on all markets. And, quite often.
Because of that, technical traders and not only, pay attention to these two reversal patterns, as they suggest the market’s inability to continue in the previous direction. For some reason, the price isn’t able to make new highs or lows, and trends reverse.
It may be that the monetary policy changed. Or, changes in the macroeconomic space drove a significant shift in market sentiment. No matter the cause, double and triple tops or bottoms have the great advantage of alerting traders when the trend changes.
And, perhaps their greatest value, they take a lot of time to form. Therefore, traders virtually have no excuse not seeing and interpreting double and triple tops and bottoms.
Trading the Double Top or Bottom
As the name suggests, the market fails twice at the same level. Because execution improved drastically in the last years, traders should not fall into the trap of expecting a fix level for a double or triple pattern. Instead, look for an area where the price failed.
Recognizing a double top or bottom is relatively straightforward. They resemble the letters M or W.
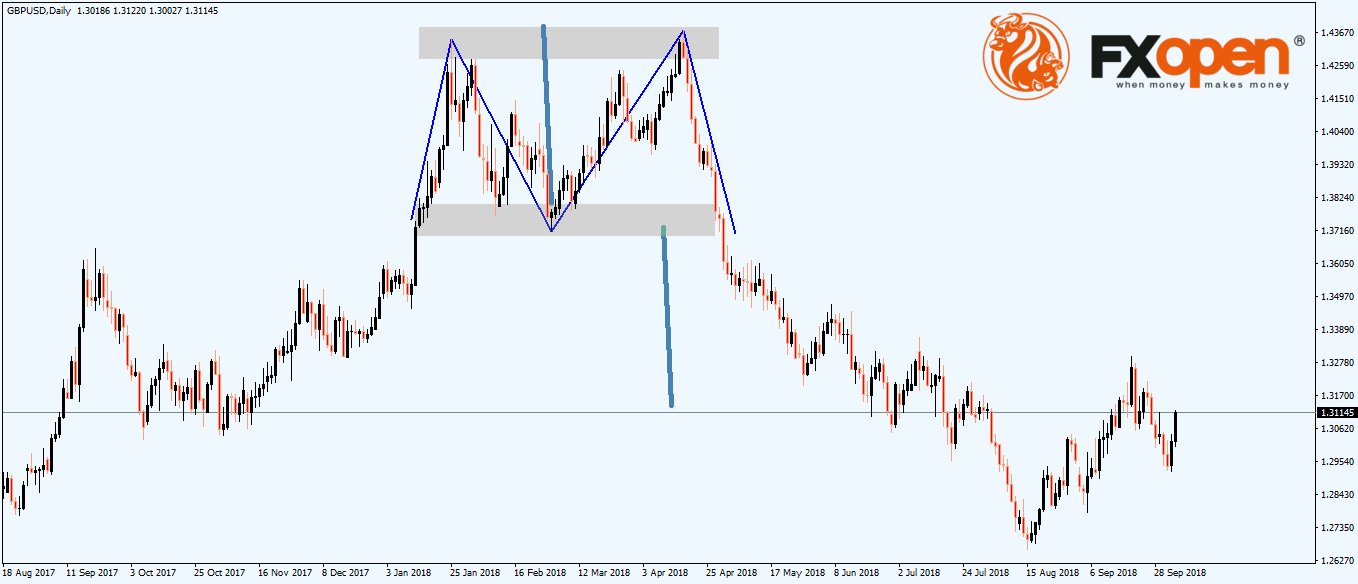
Check the GBPUSD daily chart from above. Recently, the cable pair, as the GBPUSD pair is also called, formed a double top around the 1.43 level.
In fact, the pair was on a steady trend higher following the Brexit drop. It formed a series of higher highs and higher lows, consistent with strong, bullish trends. As such, it recovered most of the Brexit related losses. However, the 1.43 level proved to be a difficult one to break.
For whatever the reason, the pair failed at the level and formed the letter M. That’s a double top, with thick, blue line, showing the measured move for the technical pattern.
Trading the Triple Top or Bottom
The triple top or bottom pattern is similar. But, instead of the price failing twice at the same area, it gives another shot at it.
Triple tops or bottoms aren’t that common like the double ones. Market forces fight at certain levels and uncertainty is the name of the game.
As reversal patterns, triple tops or bottoms consume a lot of time. And, they are tricky patterns, too!
Because they form against a horizontal level and during a market advance or decline, many interpret them as ascending or descending triangles. Or, continuation patterns, when in fact, the market prepares to bottom or top.
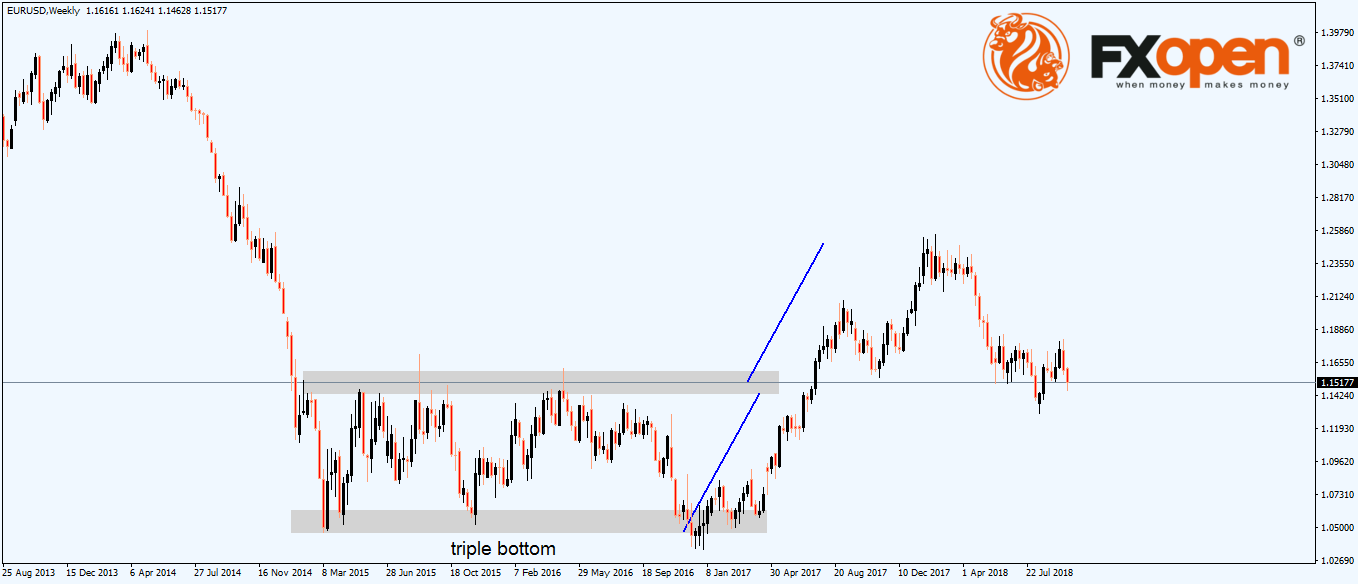
Take the EURUSD pair, for instance. The recent triple bottom took over two-and-a-half years to form. Eventually, the market reversed, and the rally didn’t stall until the pair completed the measured move.
Conclusion
The biggest advantage of double and triple tops and bottoms is that they take a lot of time to form. Traders can’t possibly miss them, providing the timeframe is big enough.
But this is also one of their major problems. Unlike Japanese candlesticks reversal patterns, double and triple tops or bottoms test the trader’s patience.
The measured move confirms the double or triple top or bottom. Also, the areas provide firm support and resistance levels every time the market tests them in the future.
As reversal patterns, they are one of the most powerful ones belonging to classic technical analysis. They stood the test of time and will remain a pillar of the Western approach to technical analysis for the years to come.
This article represents the opinion of the Companies operating under the FXOpen brand only. It is not to be construed as an offer, solicitation, or recommendation with respect to products and services provided by the Companies operating under the FXOpen brand, nor is it to be considered financial advice.
Latest articles

Google Share Price Rose Post-market to a New All-time Record
Yesterday, after the close of the main trading session, a report on activities for the 1st quarter of Alphabet Inc. (Google's parent company) was published. The report was strong, exceeding investors' expectations.
→ Quarterly EPS = USD 1.89 (expected = USD 1.

S&P 500 Rebounds after Negative GDP News
Data released yesterday showed US GDP growth slowed to 1.6% in the first quarter of the year. According to ForexFactory: forecast = 2.2%, past value = 2.4%.
Reaction to the news sent the S&P 500 mini stock

GBP/USD And USD/CAD Daily Chart Outlook
GBP/USD is attempting a recovery wave from 1.2300. USD/CAD is consolidating and might aim for a move above the 1.3760 resistance zone.
Important Takeaways for GBP/USD and USD/CAD Analysis Today
· The British Pound started