


FXOpen
Gold extended upside movement on Thursday, increasing the price of yellow metal to more than $1340, the highest level since March 18 following the release of Federal Open Market Committee (FOMC) monetary policy minutes and increase in the China imports. The long term sentiment remains bullish due to Higher High and Higher Low in the recent wave.
Technical Analysis
As of this writing, the precious metal is being traded near $1341 an ounce. A hurdle may be seen around $1342, the 23.6% fib level ahead of $1392, the swing high of the recent upside move and then the $1400 milestone. A break above the $1392 resistance area will print a Higher High on the daily chart, hence confirming the bullish momentum in the long run.
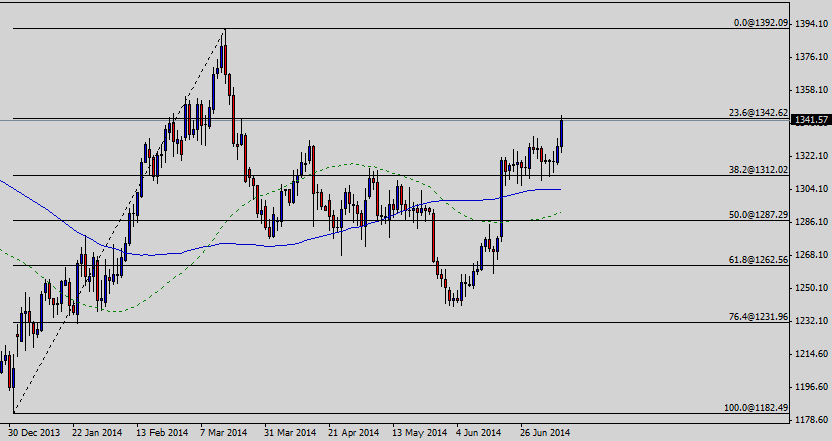
On the downside, the precious metal is expected to find a support around $1312, the 38.2% fib level ahead of $1304, the 100 Simple Moving Average (SMA) and then $1287, the 50% fib level as demonstrated in the above chart.
China Imports
The imports of China increased by 5.5% last month as compared to 1.6% decline in the month before, a government report revealed earlier this week. The Asian nation is the largest consumer of the precious metal, so an increase in the imports spurred bullish momentum in the price of bullion.
FOMC Minutes
The Federal Reserve releases the minutes from the FOMC monetary policy meeting on Wednesday. The policymakers didn’t signal earlier than expected hike in the benchmark interest rate which consequently spurred bearish momentum in the US Dollar.
Conclusion
Considering the overall technical and fundamental outlook, buying the yellow metal on dips still appears to be a good strategy, for this purpose the above mentioned support levels may prove to be good buying areas.
Trade over 50 forex markets 24 hours a day with FXOpen. Take advantage of low commissions, deep liquidity, and spreads from 0.0 pips. Open your FXOpen account now or learn more about trading forex with FXOpen.
This article represents the opinion of the Companies operating under the FXOpen brand only. It is not to be construed as an offer, solicitation, or recommendation with respect to products and services provided by the Companies operating under the FXOpen brand, nor is it to be considered financial advice.
Latest from Forex Analysis
Latest articles

Google Share Price Rose Post-market to a New All-time Record
Yesterday, after the close of the main trading session, a report on activities for the 1st quarter of Alphabet Inc. (Google's parent company) was published. The report was strong, exceeding investors' expectations.
→ Quarterly EPS = USD 1.89 (expected = USD 1.

S&P 500 Rebounds after Negative GDP News
Data released yesterday showed US GDP growth slowed to 1.6% in the first quarter of the year. According to ForexFactory: forecast = 2.2%, past value = 2.4%.
Reaction to the news sent the S&P 500 mini stock

GBP/USD And USD/CAD Daily Chart Outlook
GBP/USD is attempting a recovery wave from 1.2300. USD/CAD is consolidating and might aim for a move above the 1.3760 resistance zone.
Important Takeaways for GBP/USD and USD/CAD Analysis Today
· The British Pound started