


FXOpen

Gold price is facing an uphill task and it is struggling to break the $1,460 support area. Crude oil price is rising and it is now trading nicely above the $56.50 support.
Important Takeaways for Gold and Oil
- Gold price failed to climb above the $1480 resistance area and declined recently against the US Dollar.
- There was a break below a major bullish trend line with support near $1,465 on the hourly chart of gold.
- Crude oil price is showing a lot of positive signs above the $56.50 and $57.00 levels.
- There was a break above a key bearish trend line with resistance near $57.05 on the hourly chart of XTI/USD.
Gold Price Technical Analysis
Recently, gold price failed the break the $1,478 and $1,480 resistance levels against the US Dollar. It failed to continue higher and started a renewed bearish wave below the $1,470 level.
Moreover, there was a break below the $1,468 support and 50 hourly simple moving average. Finally, there was a break below a major bullish trend line with support near $1,465 on the hourly chart of gold.
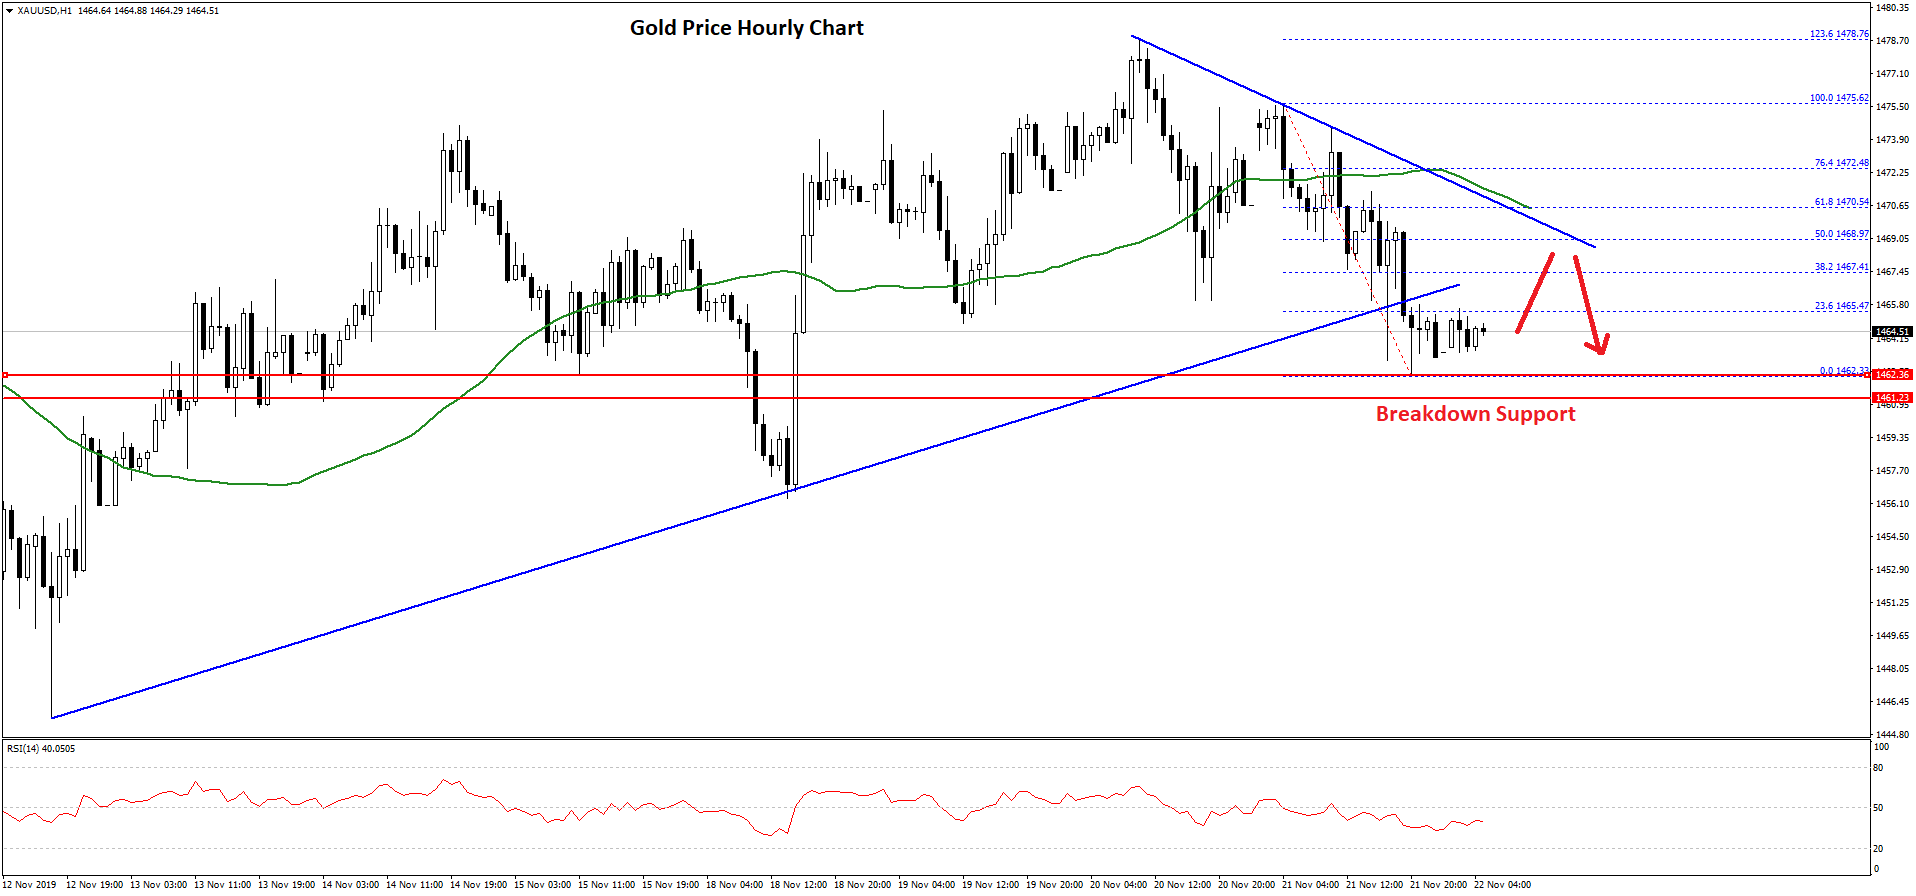
The price traded close to the $1,460 support area and a low was formed near $1,462. At the moment, the price is consolidating losses above $1,460. An immediate resistance is near the 23.6% Fib retracement level of the recent decline from the $1,475 high to $1,462 low.
On the upside, there are many resistances on the upside near the $1,468 and $1,470 levels. There is also a connecting bearish trend line forming with resistance near the $1,468 level on the same chart.
Moreover, the 50% Fib retracement level of the recent decline from the $1,475 high to $1,462 low is also near the $1,468 level to prevent an upside break. Finally, the price must break the $1,470 resistance and the 50 hourly simple moving average to start a strong rise.
On the downside, an initial support is near the $1,460 level. If gold price fails to stay above the $1,460 support, there are chances of a push towards the $1,450 level.
Oil Price Technical Analysis
This week, there was a strong increase in crude oil price above the $56.50 resistance area against the US Dollar. The price even broke the $57.00 resistance zone to move into a bullish zone.
Moreover, there was a break above a key bearish trend line with resistance near $57.05 on the hourly chart of XTI/USD. Finally, the price climbed above the $58.00 level and settled well above the 50 hourly simple moving average.
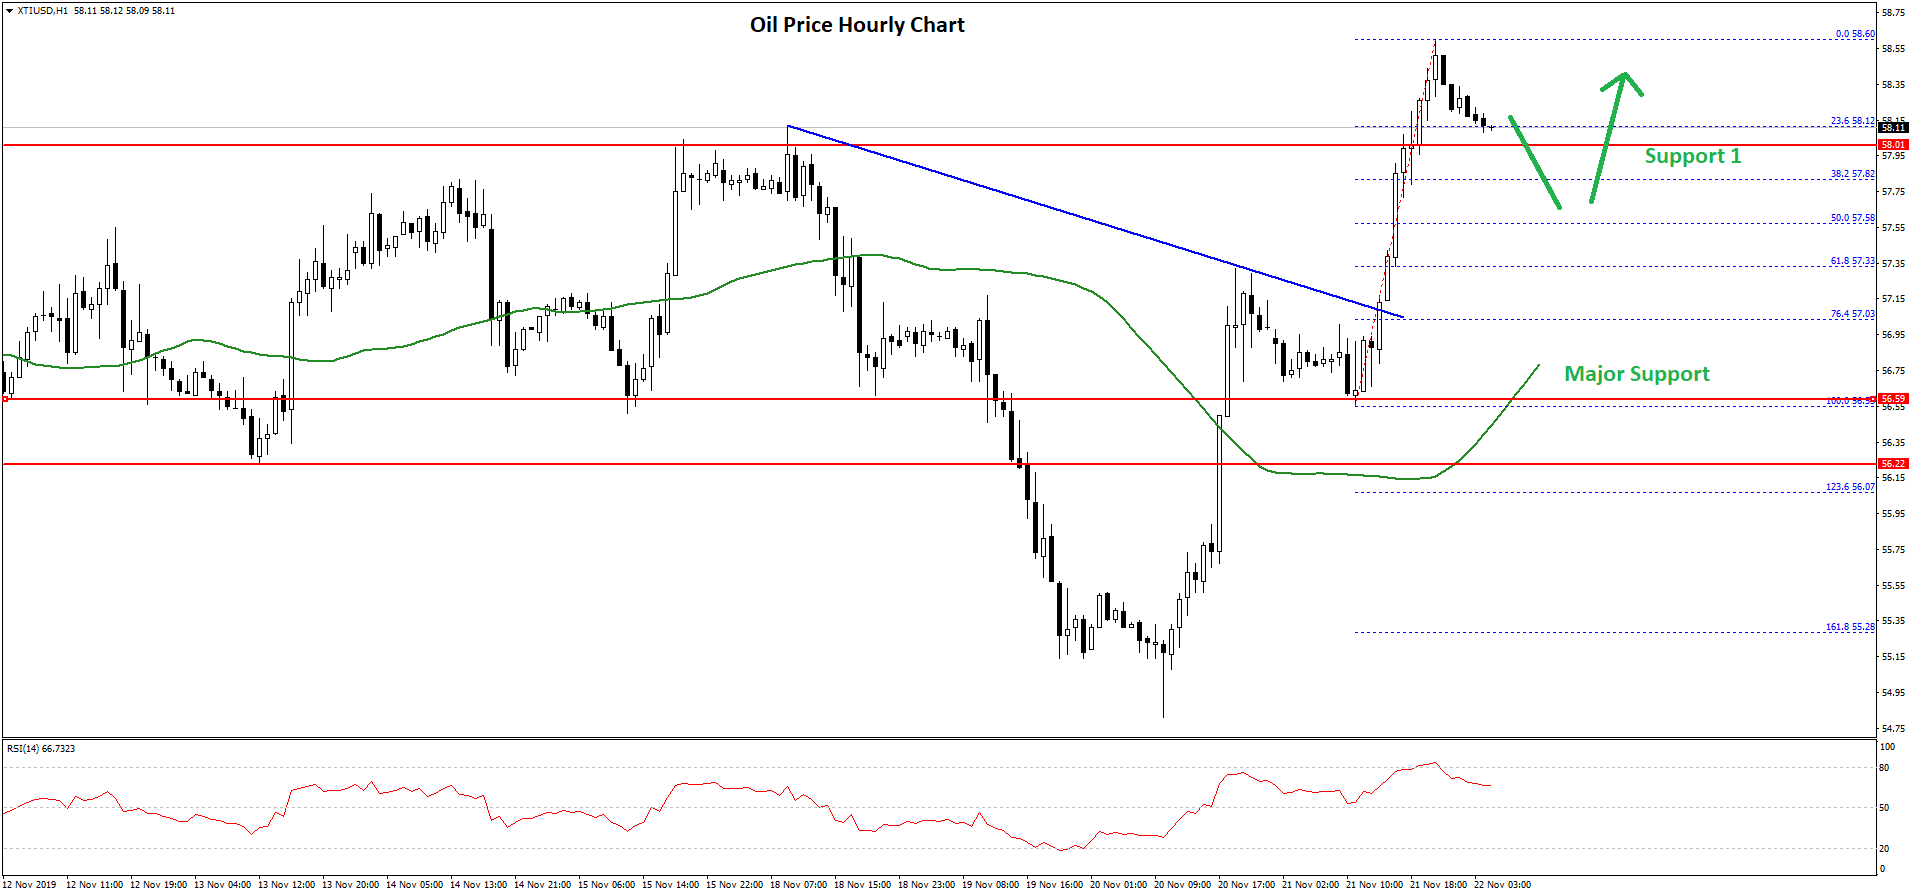
A new high was formed near $58.60 and the price is currently correcting lower. It is testing the 23.6% Fib retracement level of the recent leg from the $56.58 low to $58.60 high.
On the downside, there are many supports near the $57.80 and $57.50 levels. The first key support is near $57.50 and the 50% Fib retracement level of the recent leg from the $56.58 low to $58.60 high.
Therefore, dips remain well supported on the downside near the $57.50 level. Any further losses may perhaps push the price towards the $56.50 support area.
On the upside, the $58.50 and $58.60 levels are initial hurdles for crude oil price. A successful break above the $58.60 level could push the price towards the $60.00 level.
Trade over 50 forex markets 24 hours a day with FXOpen. Take advantage of low commissions, deep liquidity, and spreads from 0.0 pips. Open your FXOpen account now or learn more about trading forex with FXOpen.
This article represents the opinion of the Companies operating under the FXOpen brand only. It is not to be construed as an offer, solicitation, or recommendation with respect to products and services provided by the Companies operating under the FXOpen brand, nor is it to be considered financial advice.
Latest from Forex Analysis
Latest articles

XAU/USD Gold Price Reaches an Important Resistance Zone
The XAU/USD gold chart today indicates that the historical record price of the metal is above USD 2,400 per ounce.
In addition to fears of a new round of inflation due to rising commodity prices, geopolitical tensions are

What Is a Break of Structure and How Can You Trade It?
In the ever-evolving world of Smart Money Concept (SMC) trading, a nuanced understanding of market dynamics is indispensable. This article explores the concept of Break of Structure (BOS), how to identify it, and its implications for trading strategies, setting traders

Hong Kong Stocks Become Top Risers After Wild Ride Subsides
Hong Kong enjoyed a sterling reputation for an entire century as a highly polished, utterly stable mantlepiece upon which global corporations could comfortably sit and where an international talent base could reside in fabulous surroundings and approach European, American, African