


FXOpen
Gold price declined heavily and broke the $1,300 support level to move into a bearish zone. Crude oil price might decline sharply if there is a downside break below the $56.25 support level.
Important Takeaways for Gold and Oil
- Gold price declined sharply after topping near the $1,330 resistance against the US Dollar.
- There is a short term bearish trend line formed with resistance at $1,288 on the hourly chart of gold.
- Crude oil price is forming a contracting triangle with support near the $56.25 level on the hourly chart of XTI/USD.
- There could be a sharp decline if the price trades below the $56.25 and $56.00 support levels.
Gold Price Technical Analysis
After a strong upward move, gold price faced a strong resistance near the $1,330 level against the US Dollar. The price started a fresh bearish wave and declined below the $1,320 and $1,310 support levels.
The decline was strong since the price even broke the $1,300 support level. Finally, there was a close below the $1,300 support and the 50 hourly simple moving average. The price moved below the $1,290 support and a low was formed near the $1,280 level on FXOpen.
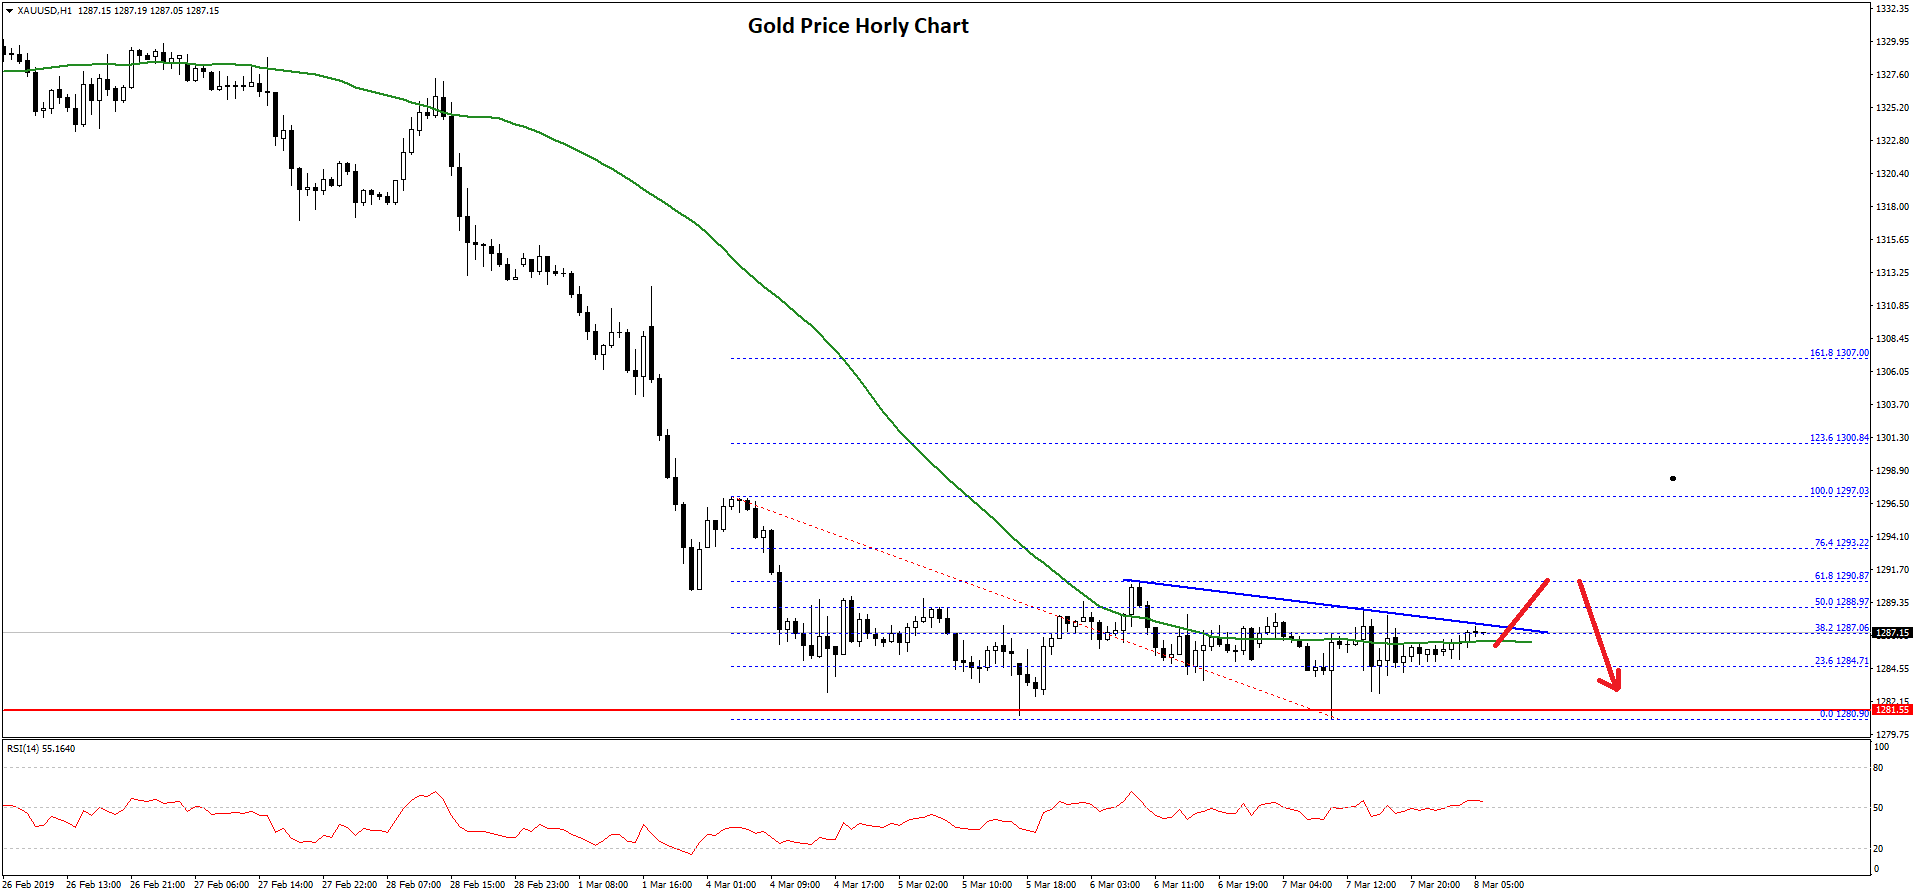
Later, the price started consolidating gains and corrected above the $1,285 level and the 23.6% Fib retracement level of the recent decline from the $1,297 high to $1,280 low.
However, the price is facing a strong resistance near the $1,288 level. There is also a short term bearish trend line formed with resistance at $1,288 on the hourly chart of gold. The 50% Fib retracement level of the recent decline from the $1,297 high to $1,280 low is also near the $1,288 level.
If there is a break above the $1,288 and $1,290 levels, the price could recover towards the $1,297 level or the $1,300 resistance.
On the downside, the $1,280 support level is an important barrier for sellers. If they succeed in clearing $1,280, there is a risk of a downside break below the $1,275 level.
Oil Price Technical Analysis
Crude oil price rallied recently and broke the $56.50 and $57.00 resistance levels against the US Dollar. The price even broke the $57.80 resistance and traded towards the $58.00 level before starting a downside correction.
There were a couple of swing moves before the price broke the $56.50 and $56.20 support levels. A low was formed at $55.70 and later the price recovered to $57.23.
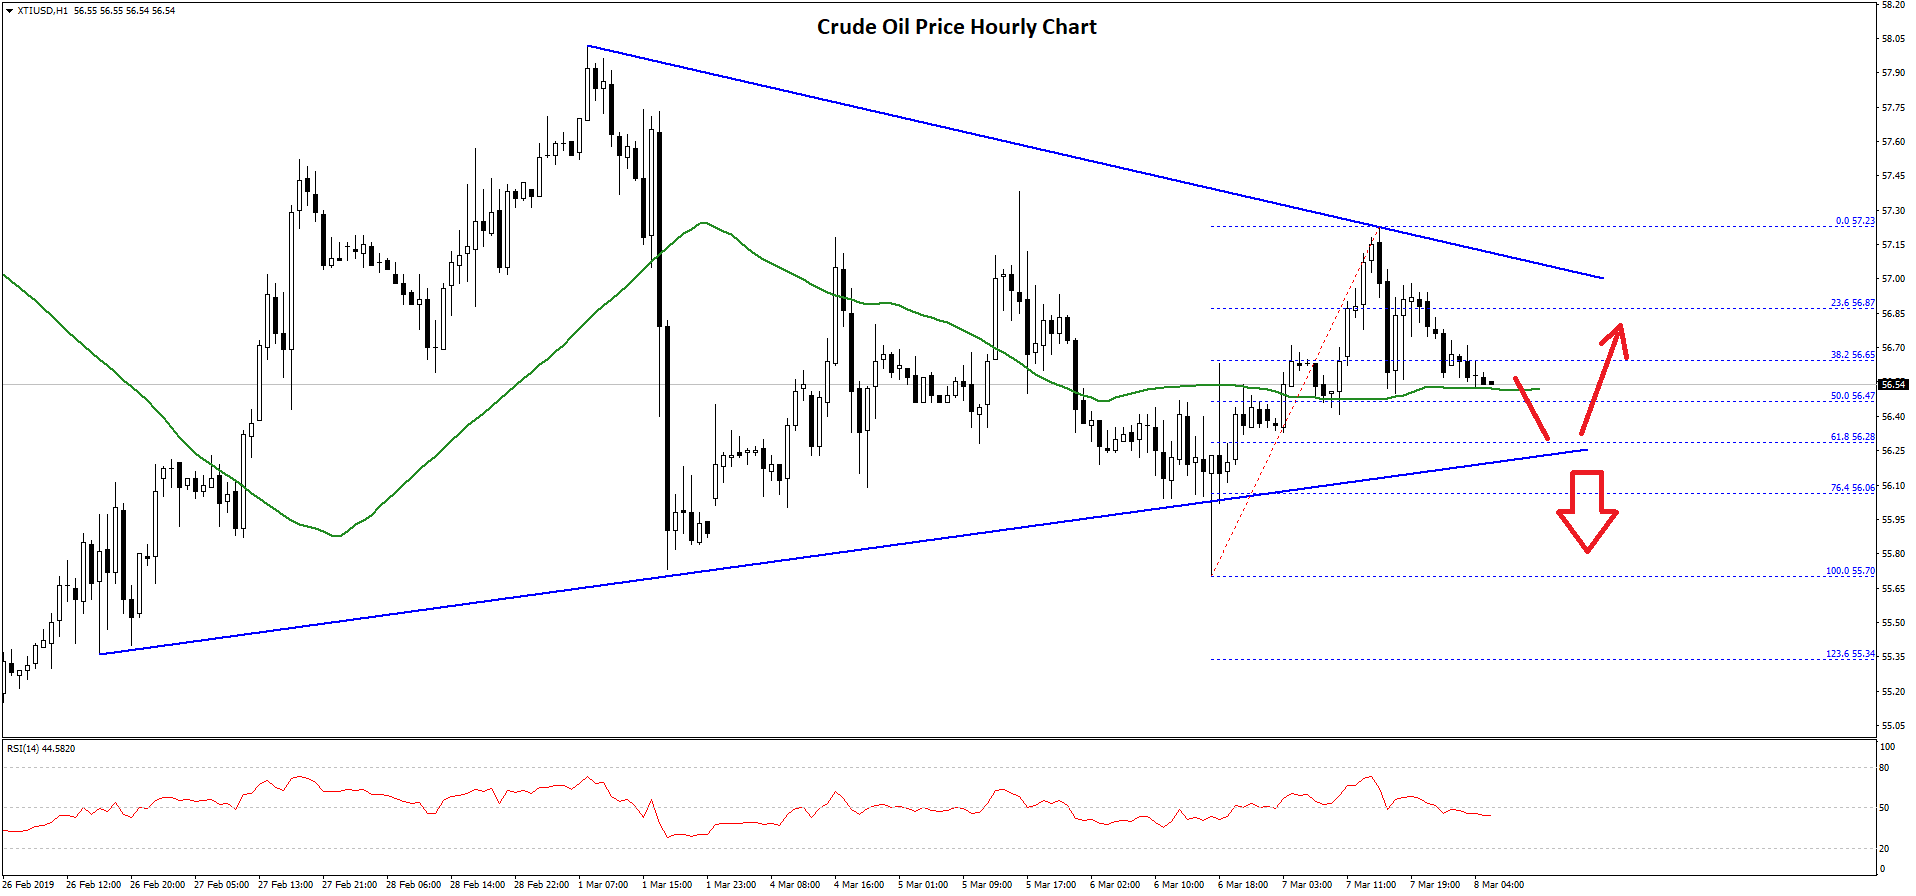
At the moment, the price is moving lower and it recently broke the $56.80 support. An immediate support is near the $56.50 level, the 50 hourly simple moving average, and the 50% Fib retracement level of the recent wave from the $55.70 low to $57.23 high.
More importantly, there is a contracting triangle formed with support near the $56.25 level on the hourly chart of XTI/USD. The triangle support is close to the 61.8% Fib retracement level of the recent wave from the $55.70 low to $57.23 high.
If there is a break below the triangle support and $56.20, the price could decline sharply in the near term. The next key support is at $56.00, below which the price may revisit the $55.75 support. On the upside, the main resistances are near $57.00 and $57.50.
Trade over 50 forex markets 24 hours a day with FXOpen. Take advantage of low commissions, deep liquidity, and spreads from 0.0 pips. Open your FXOpen account now or learn more about trading forex with FXOpen.
This article represents the opinion of the Companies operating under the FXOpen brand only. It is not to be construed as an offer, solicitation, or recommendation with respect to products and services provided by the Companies operating under the FXOpen brand, nor is it to be considered financial advice.
Latest from Forex Analysis
Latest articles

Google Share Price Rose Post-market to a New All-time Record
Yesterday, after the close of the main trading session, a report on activities for the 1st quarter of Alphabet Inc. (Google's parent company) was published. The report was strong, exceeding investors' expectations.
→ Quarterly EPS = USD 1.89 (expected = USD 1.

S&P 500 Rebounds after Negative GDP News
Data released yesterday showed US GDP growth slowed to 1.6% in the first quarter of the year. According to ForexFactory: forecast = 2.2%, past value = 2.4%.
Reaction to the news sent the S&P 500 mini stock

GBP/USD And USD/CAD Daily Chart Outlook
GBP/USD is attempting a recovery wave from 1.2300. USD/CAD is consolidating and might aim for a move above the 1.3760 resistance zone.
Important Takeaways for GBP/USD and USD/CAD Analysis Today
· The British Pound started