


FXOpen
Gold price started a decent upward move after forming a support base near $1,274. Crude oil price declined heavily and it remains at a risk of more losses below $55.00
Important Takeaways for Gold and Oil
- Gold price started a nice upward move after testing the $1,274 support against the US Dollar.
- There was a break above a major bearish trend line with resistance at $1,284 on the hourly chart of gold.
- Crude oil price declined sharply and traded below the $62.00 and $60.00 support levels.
- There was a break below a bearish flag pattern with support at $58.40 on the hourly chart of XTI/USD.
Gold Price Technical Analysis
Gold price found support near the $1,270 level and recently started an upward move against the US Dollar. The price settled above the $1,274 pivot level and extended gains above the $1,280 level.
The recent rise was positive above the $1,285 and $1,290 resistance levels. Moreover, there was a close above the $1,285 level and the 50 hourly simple moving average.
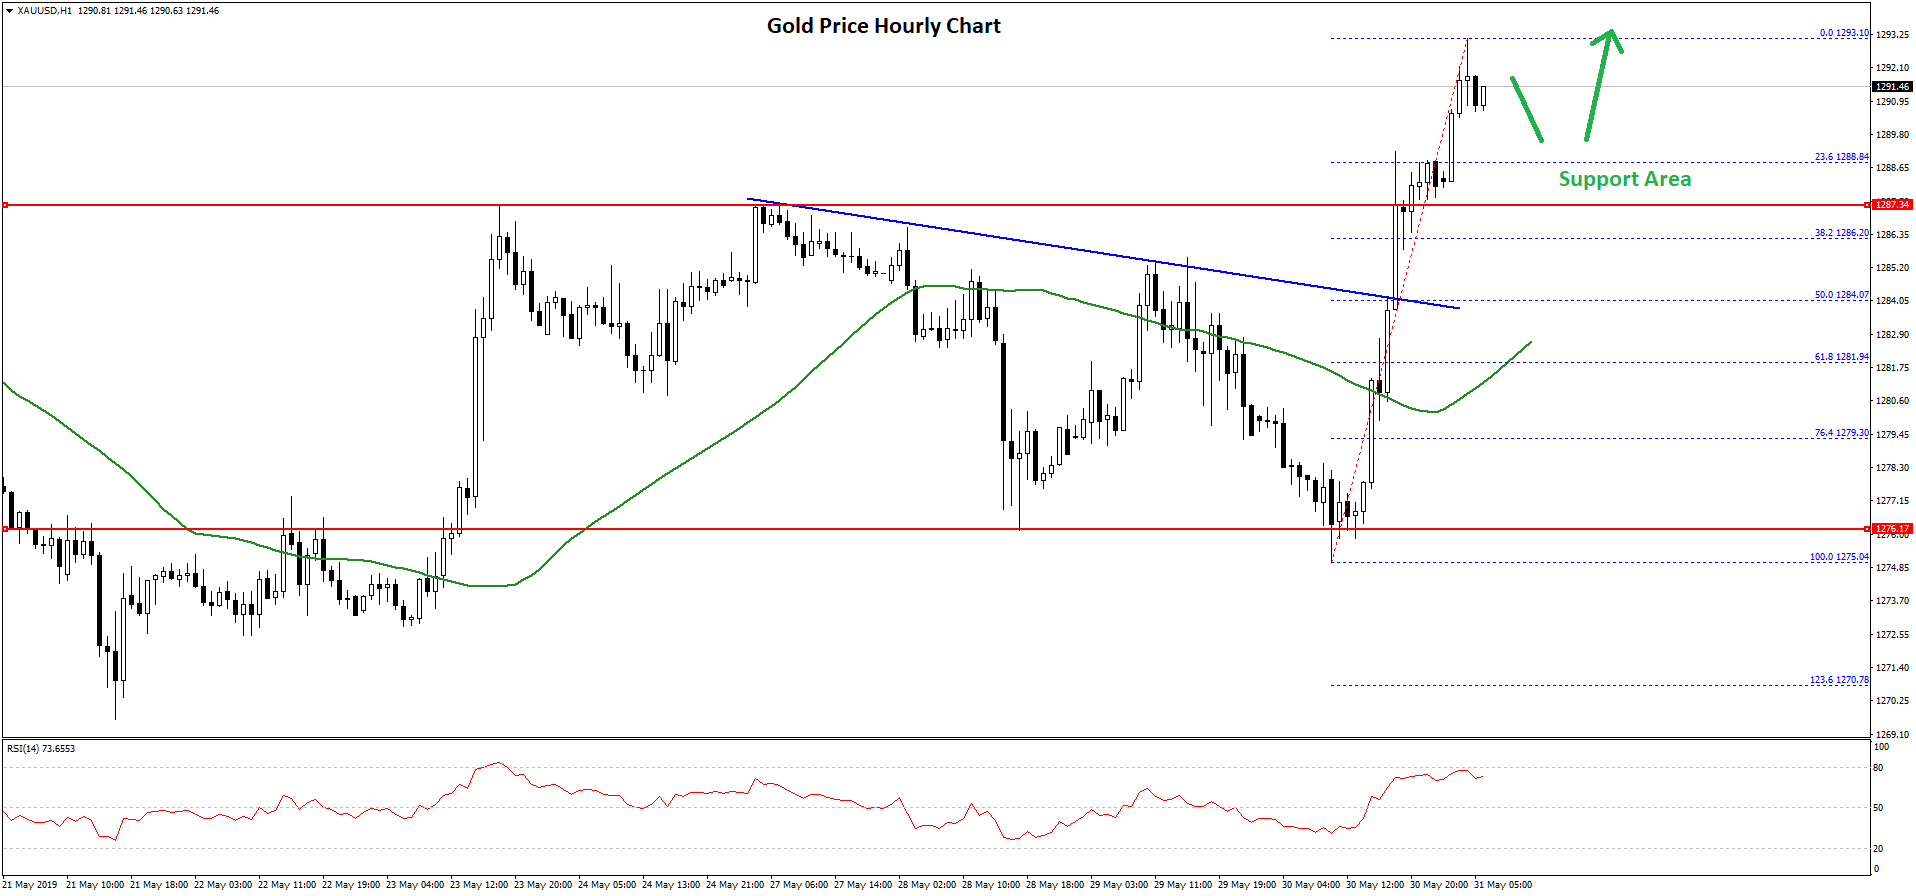
During the upward move, there was a break above a major bearish trend line with resistance at $1,284 on the hourly chart of gold. The price traded above the $1,290 level and recently traded close to the $1,294 level on FXOpen.
At the moment, the price is correcting lower towards $1,288. An initial support is near the 23.6% Fib retracement level of the recent wave from the $1,275 swing low to $1,294 high.
However, the main support is near the $1,288 level (the recent resistance area). The next support is near the $1,286 level and the 38.2% Fib retracement level of the recent wave from the $1,275 swing low to $1,294 high.
If there are more losses, the price might test the $1,285 support or the 50 hourly SMA. On the upside, if the price breaks the $1,294 and $1,295 levels, it could test the $1,300 resistance area.
Oil Price Technical Analysis
Crude oil price started a strong decline from well above the $64.00 level against the US Dollar. The price broke the key $62.40 support level to enter a bearish zone and start a downtrend.
The decline was strong as the price cleared the $60.00 support level and settled below the 50 hourly simple moving average. During the decline, there was a break below a bearish flag pattern with support at $58.40 on the hourly chart of XTI/USD.
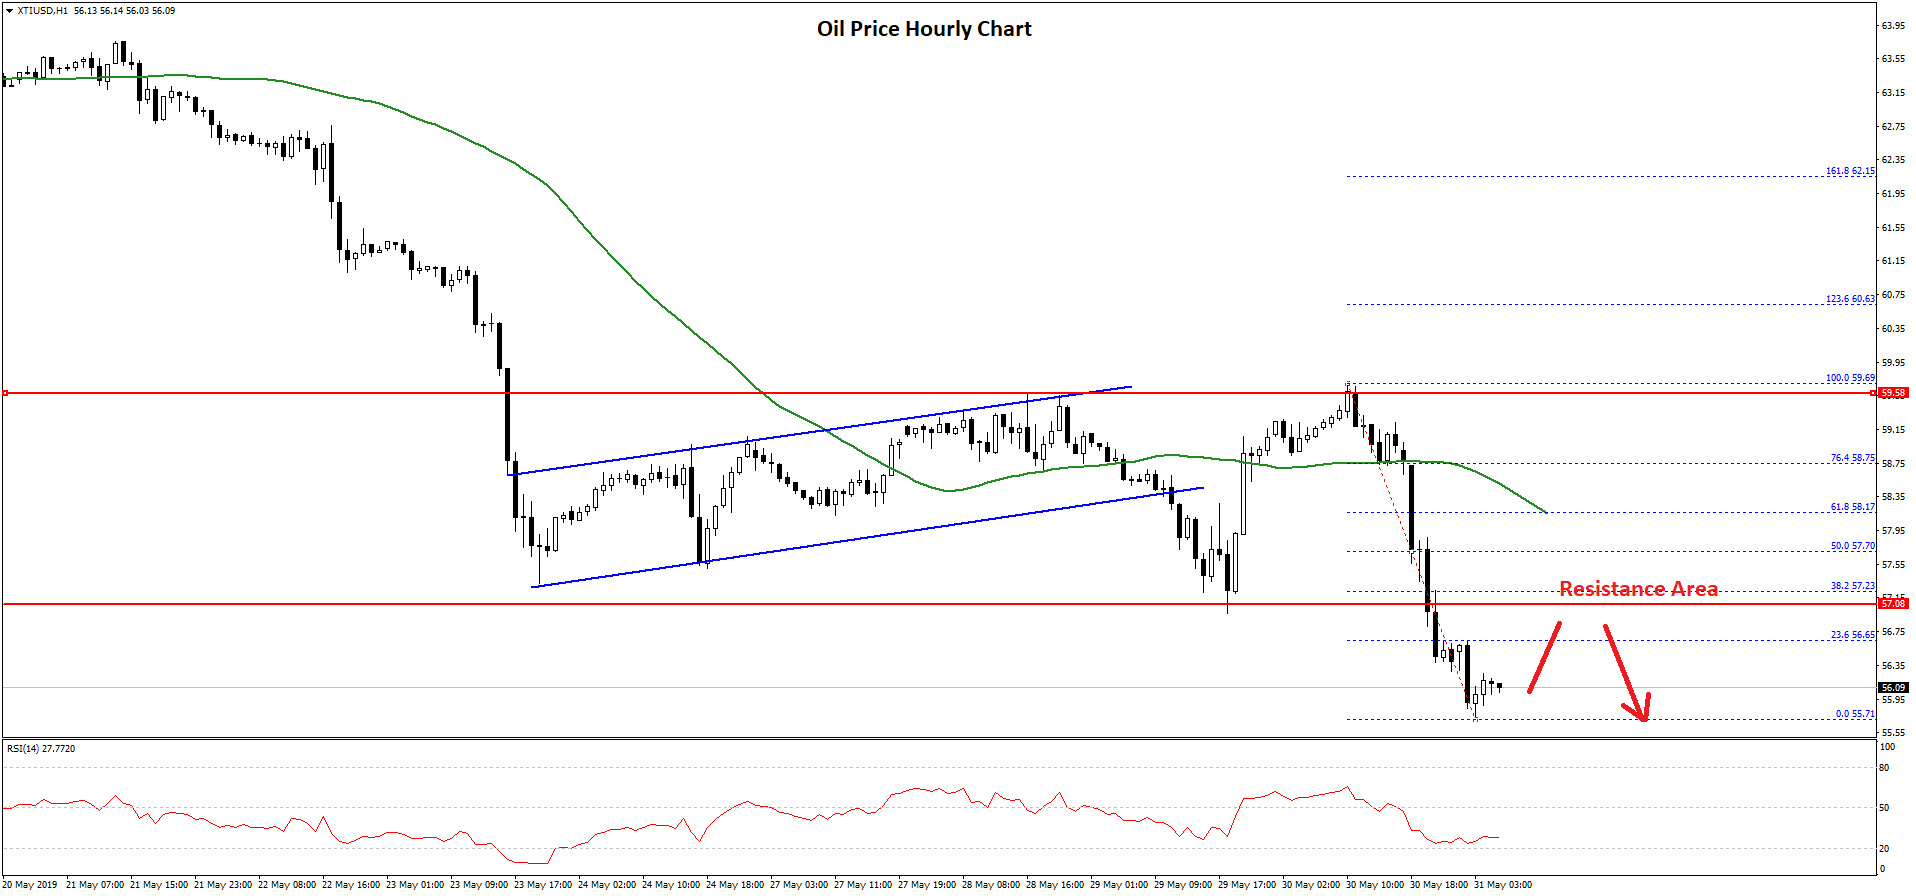
There was a decent recovery from the $57.00 support and the price revisited the $59.50 level. However, the price struggled to clear the $59.50 and $60.00 resistance levels.
Finally, there was a fresh decline below the $58.00 and $57.00 levels. A new weekly low was formed near the $55.71 level and the price is currently trading in a bearish zone.
An initial resistance is near the $56.65 level and the 23.6% Fib retracement level of the recent decline from the $59.69 high to $55.71 low. More importantly, the previous support level is near the $57.00 level is likely to act as a crucial barrier.
Above $57.00, the main resistance is near the $57.70 level, and the 50% Fib retracement level of the recent decline from the $59.69 high to $55.71 low.
On the downside, an initial support is near the $55.70 level, below which the price is likely to accelerate below the $55.00 support level.
Trade over 50 forex markets 24 hours a day with FXOpen. Take advantage of low commissions, deep liquidity, and spreads from 0.0 pips. Open your FXOpen account now or learn more about trading forex with FXOpen.
This article represents the opinion of the Companies operating under the FXOpen brand only. It is not to be construed as an offer, solicitation, or recommendation with respect to products and services provided by the Companies operating under the FXOpen brand, nor is it to be considered financial advice.
Latest from Forex Analysis
Latest articles

AUD/USD Rises Sharply on Inflation News
The Consumer Price Index for Australia was released this morning. According to ForexFactory:
→ CPI in quarterly terms: actual = 1.0%, expected = 0.8%, previous value = 0.6%;
→ CPI in annual terms: actual = 3.5%, expected = 3.4%, previous value = 3.

TSLA Share Price Up About 13% Despite Disappointing Report
Yesterday, TSLA trading closed at USD 144.68 per share, after which Tesla reported its results for the 1st quarter:
→ earnings per share: actual = USD 0.45, forecast = USD 0.49;
→ gross income: actual = USD 21.45 billion, forecast = USD

Market Analysis: Gold Price Corrects Gains While Oil Price Regains Strength
Gold price rallied above $2,400 before correcting lower. Crude oil price is rising and it could climb further higher toward the $85.50 resistance.
Important Takeaways for Gold and Oil Prices Analysis Today
· Gold price rallied significantly above $2,