


FXOpen

Gold price is trading in a strong uptrend above the $1,500 support area. Crude oil price is also likely to gain bullish momentum once it clears the key $55.50 resistance area.
Important Takeaways for Gold and Oil
- Gold price found support near the $1,490 level and is currently climbing higher against the US Dollar.
- There is major contracting triangle forming with resistance near $1,530 on the hourly chart of gold.
- Crude oil price is trading above the key $54.00 and $54.20 support levels.
- There was a break above a major bearish trend line with resistance near $54.60 on the hourly chart of XTI/USD.
Gold Price Technical Analysis
Earlier this week, gold price surged above the $1,500 and $1,510 resistance levels against the US Dollar. The price even broke the $1,520 resistance level and traded to a new yearly high at $1,535.
Recently, it corrected lower below $1,520 and $1,510. Moreover, there was a break below the $1,500 support and the 50 hourly simple moving average. A swing low was formed near $1,479 on FXOpen and the price started a fresh increase.
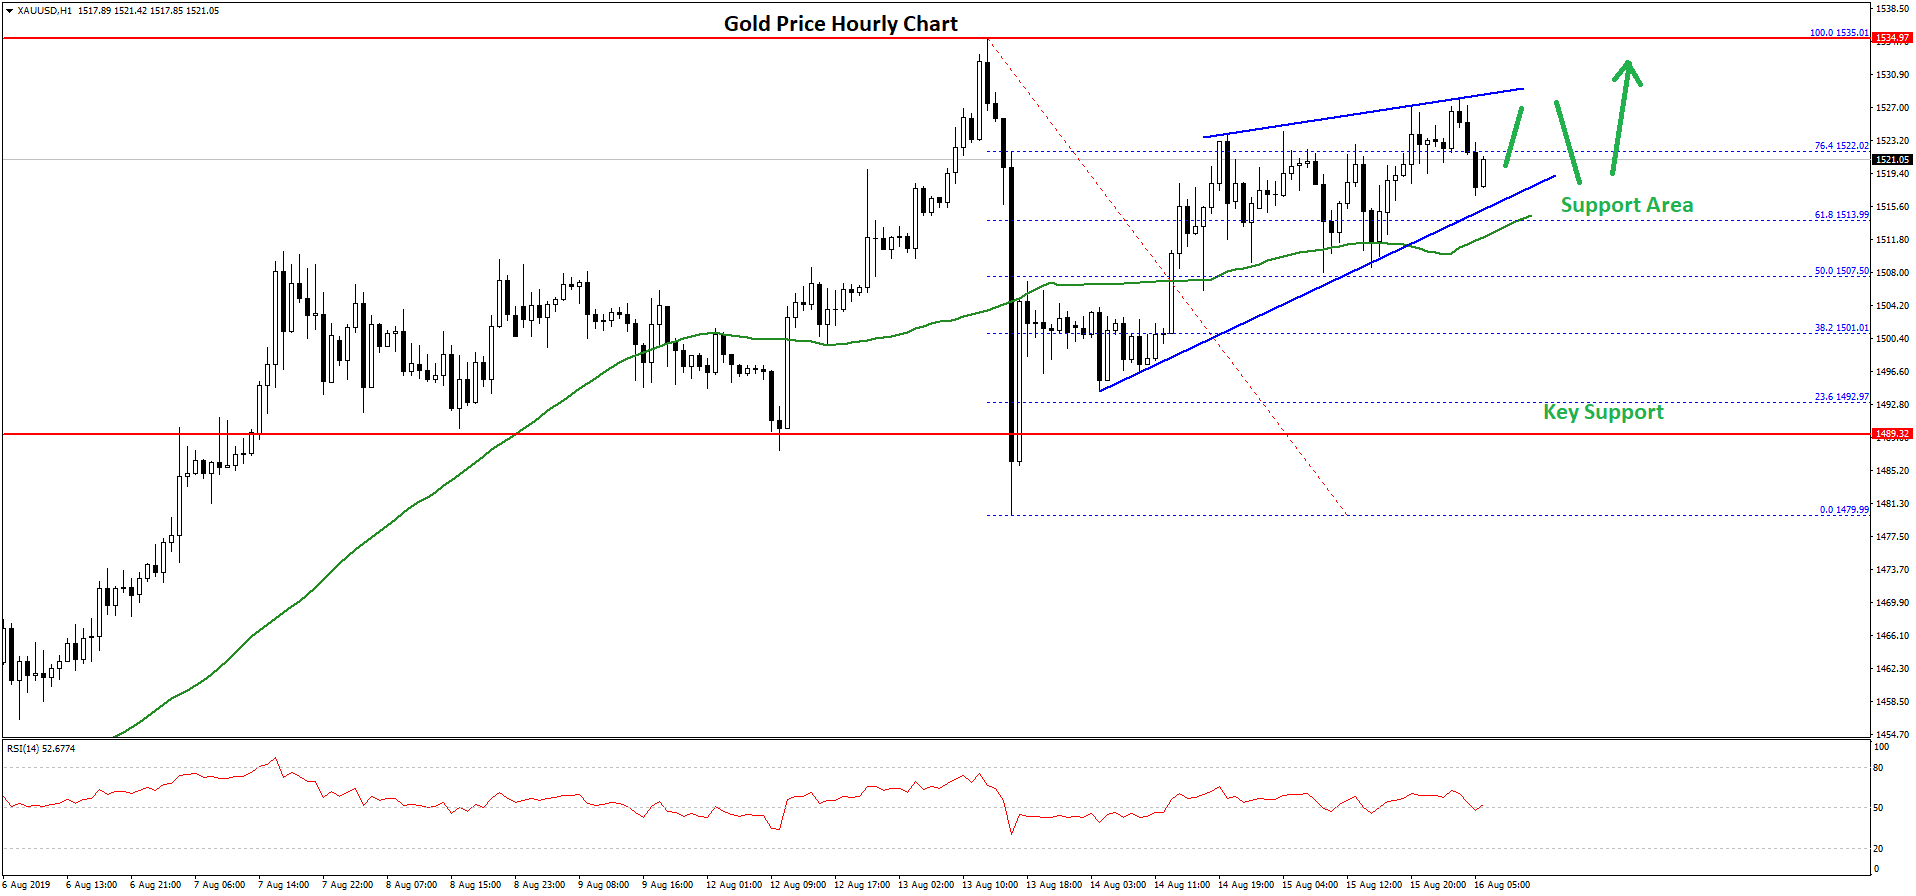
It recovered above the $1,500 level, the 50 hourly simple moving average, and the 50% Fib retracement level of the last drop from the $1,535 high to $1,479 low. The price is now trading nicely above the $1,500 level.
Moreover, there is a major contracting triangle forming with resistance near $1,530 on the hourly chart of gold. It seems like the price might continue to rise towards the $1,530 and $1,535 resistance levels.
If there are more upsides, the price could even trade past the $1,540 resistance level. On the downside, there is a strong support forming near the $1,512 level and the 50 hourly SMA.
If there is a downside break below the $1,512 support area, the price could start a fresh downward move towards the $1,480 support area.
Oil Price Technical Analysis
There was a slow and steady rise in crude oil price above the $54.00 resistance area against the US Dollar. The price traded as high as $57.36 and recently corrected below the $56.00 support.
The price even broke the $55.00 support and the 50 hourly simple moving average. A swing low was formed near $53.76 and the price is currently correcting higher.
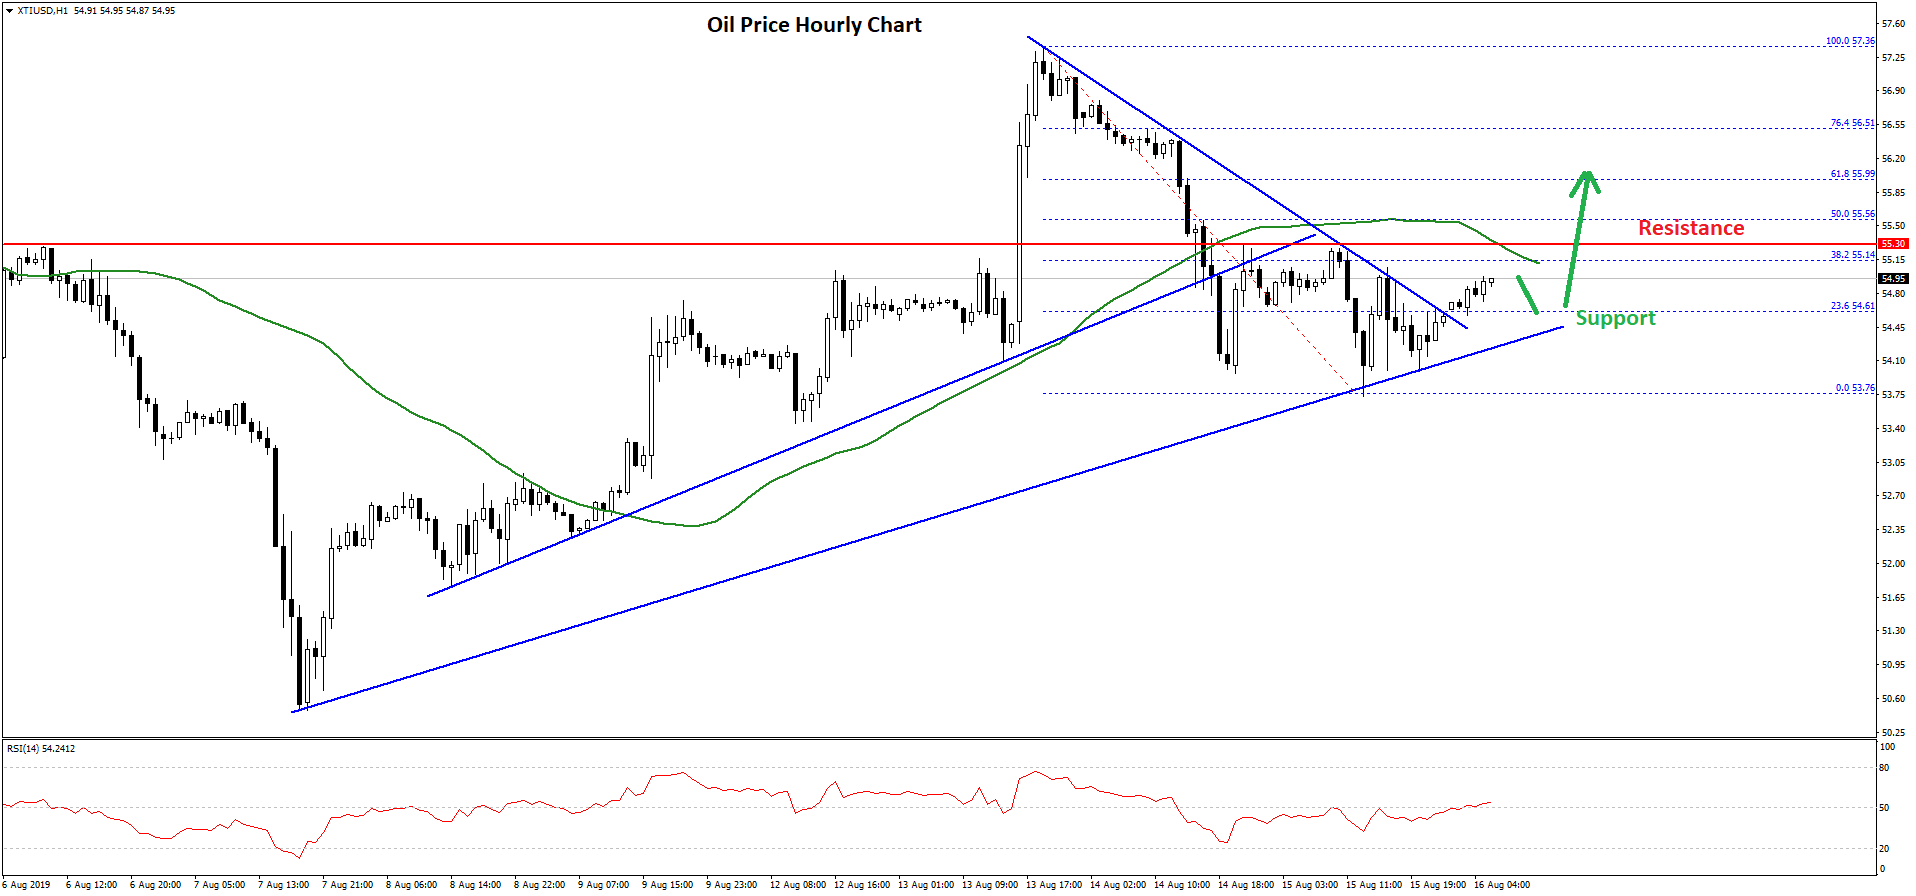
It traded above the $54.50 level plus the 23.6% Fib retracement level of the last slide from the $57.36 high to $53.76 low. Moreover, there was a break above a major bearish trend line with resistance near $54.60 on the hourly chart of XTI/USD.
However, the price is facing a strong resistance near the $55.50 level and the 50 hourly SMA. The Fib retracement level of the last slide from the $57.36 high to $53.76 low is also near the $55.55 level.
Therefore, an upside break above the $55.50 and $55.55 resistance levels might start a solid rise. The next key resistance is near the $56.00 level, above which the price could climb towards the last swing high near $57.36.
On the downside, an immediate support is near the $54.40 level and a bullish trend line on the hourly chart. If there is a downside break below $54.40 and $54.20, the price could decline towards the $52.00 support area in the near term.
Trade over 50 forex markets 24 hours a day with FXOpen. Take advantage of low commissions, deep liquidity, and spreads from 0.0 pips. Open your FXOpen account now or learn more about trading forex with FXOpen.
This article represents the opinion of the Companies operating under the FXOpen brand only. It is not to be construed as an offer, solicitation, or recommendation with respect to products and services provided by the Companies operating under the FXOpen brand, nor is it to be considered financial advice.
Stay ahead of the market!
Subscribe now to our mailing list and receive the latest market news and insights delivered directly to your inbox.


Latest articles

European Currencies Strengthen Following Donald Trump's Inauguration
The start of this trading week was marked by a sharp pullback in the US dollar. According to reports from The Wall Street Journal, the newly inaugurated US President, Donald Trump, does not intend to impose tariffs immediately after taking

Nasdaq 100: Bearish Signals Amid Increased Volatility
As revealed by the technical analysis of the 4-hour Nasdaq 100 chart (US Tech 100 mini on FXOpen), the ATR indicator has been above 125 since the start of 2025, in contrast to late 2024 when it was mostly below

Index Investing: A Practical Approach to Market Participation
Index investing has become a popular way for traders and investors to access the broader market. By tracking the performance of financial indices like the S&P 500 or FTSE 100, index investing offers diversification, lower costs, and steady