


FXOpen
The price of gold extended downside movement on Friday, dragging the price of yellow metal to less than $1160 an ounce in a range-bound Asian trading session. The technical bias remains slightly bullish due to a Higher Low on hourly timeframe in the last downside dip. The price is however holding off downward trendline nicely which may increase selling pressure in near future.
Technical Analysis
As of this writing, the price of gold is being traded near $1159 an ounce. A hurdle can be seen around $1161, the trendline resistance ahead of $1166, the swing high of the last hourly wave as demonstrated in the following chart. A break and daily closing above the trendline resistance could incite renewed buying interest, validating a move towards the 1167 and 1180.
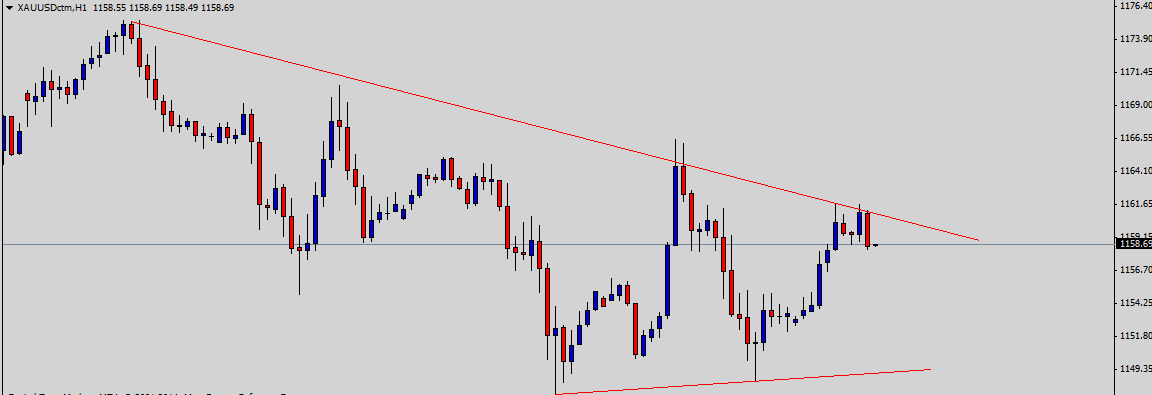
On the downside, the price of bullion is likely to find a support around $1158, the low of the last hourly candle ahead of $1150, the confluence of psychological number as well as trendline support. The technical bias will remain slightly bullish as long as the $1152 hurdle remains intact.
US Producer Price Index
The US Producer Price Index news is due today in the New York opening session. According to the average forecast of different economists, the producer price index remained 0% in February as compared to the same reading in the same month of the year before. Generally speaking, higher producer price index reading is considered positive for the economy thus a better than expected actual outcome may spur bearish momentum in the price of gold.
Trade Idea
Considering the overall technical and fundamental outlook, buying the yellow metal on an hourly close above the trendline resistance area could be a good strategy in short to medium term.
Trade over 50 forex markets 24 hours a day with FXOpen. Take advantage of low commissions, deep liquidity, and spreads from 0.0 pips. Open your FXOpen account now or learn more about trading forex with FXOpen.
This article represents the opinion of the Companies operating under the FXOpen brand only. It is not to be construed as an offer, solicitation, or recommendation with respect to products and services provided by the Companies operating under the FXOpen brand, nor is it to be considered financial advice.
Latest from Forex Analysis
Latest articles

Since the Start of the Week, Brent Oil Price Has Dropped over 4%
At the beginning of the week, March 15, we wrote that the price of Brent oil could form a correction from the resistance level of USD 91 per barrel. Since then, the price has decreased by more than 4% due

Fair Value Gaps vs Liquidity Voids in Trading
Understanding fair value gaps and liquidity voids is essential for traders seeking to navigate the complexities of the financial markets. These concepts, deeply rooted in the Smart Money Concept (SMC), provide valuable insights into the dynamics of supply and demand,

UK100 Share Index Rises as UK Inflation Slows
Yesterday, the UK Office for National Statistics (ONS) reported that the CPI stood at 3.2% in March. According to ForexFactory, analysts expected 3.1%, and a month ago the index was 3.4%.
Grant Fitzner, chief economist at the