


FXOpen
Gold price started a solid upward move from the $1,238 low and broke the $1,260 resistance. Crude oil price remains in a downtrend and it could decline below $43.00 in the near term.
Important Takeaways for Gold and Oil
- Gold price gained a lot of bullish momentum above the $1,270 resistance against the US Dollar.
- There is a major ascending channel with support at $1,269 on the hourly chart of gold.
- Crude oil price is struggling to move past the $46.00 and $47.00 resistances.
- There is a key bearish trend line formed with resistance at $46.20 on the hourly chart of XTI/USD.
Gold Price Technical Analysis
Gold price remained a significant uptrend and it started a solid upward move from the $1,238 swing low against the US Dollar. The price broke the $1,240 and $1,255 resistance levels to enter a medium term uptrend.
There was a proper close above the $1,260 resistance and the 50 hourly simple moving average. The price climbed above the $1,270 and $1,275 resistance levels. A high was formed at $1,279 and later the price corrected lower.
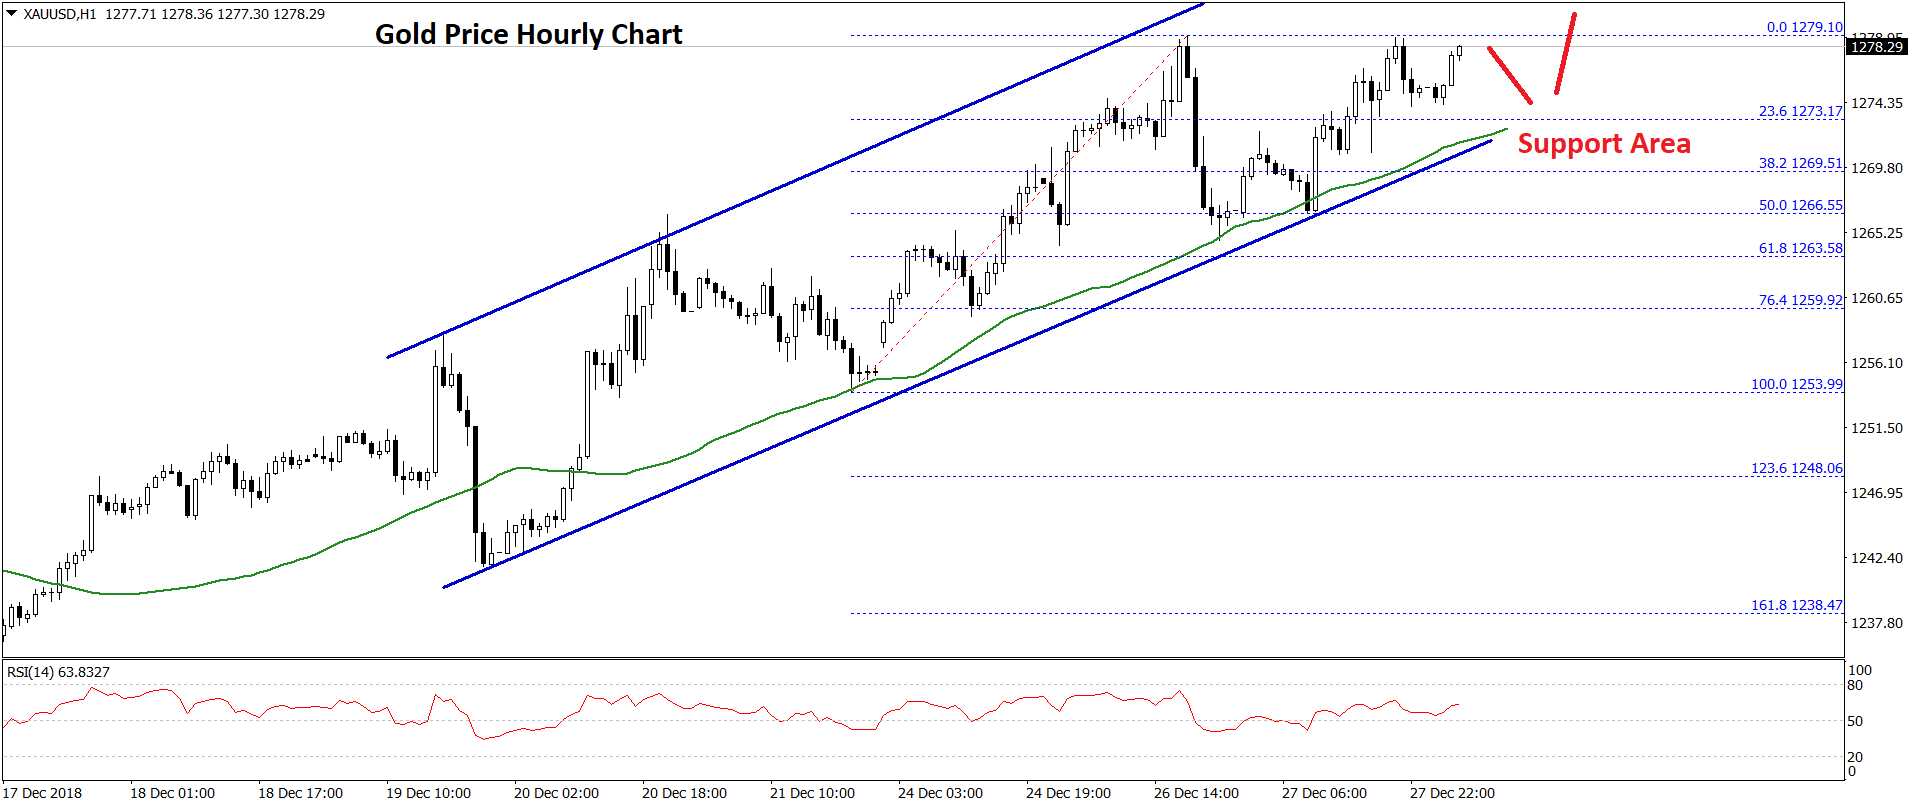
Sellers pushed the price below the $1,270 level and the 38.2% Fib retracement level of the last wave from the $1,253 low to $1,279 high. However, the price found support near the $1,265 level.
More importantly, there is a major ascending channel formed with support at $1,269 on the same chart. Besides, the 50% Fib retracement level of the last wave from the $1,253 low to $1,279 high. Should there be a downside break below the $1,266 and $1,265 support levels, there could be a strong downward move towards the $1,260 support.
On the upside, there is a major resistance at $1,279-$1,280, above which the price could move towards the $1,285 and $1,290. The next major resistance is near the $1,300 level.
Oil Price Technical Analysis
Crude oil price declined further below the $47.00 and $45.00 support levels against the US Dollar. The price even broke the $44.00 support level and traded towards the $42.00 level.
A low was formed at $42.11 and later started an upward move. The price jumped above the $45.00 and $46.00 resistance levels. However, the price struggled to clear the $47.00 barrier. Besides, there is a key bearish trend line formed with resistance at $46.20 on the hourly chart of XTI/USD.
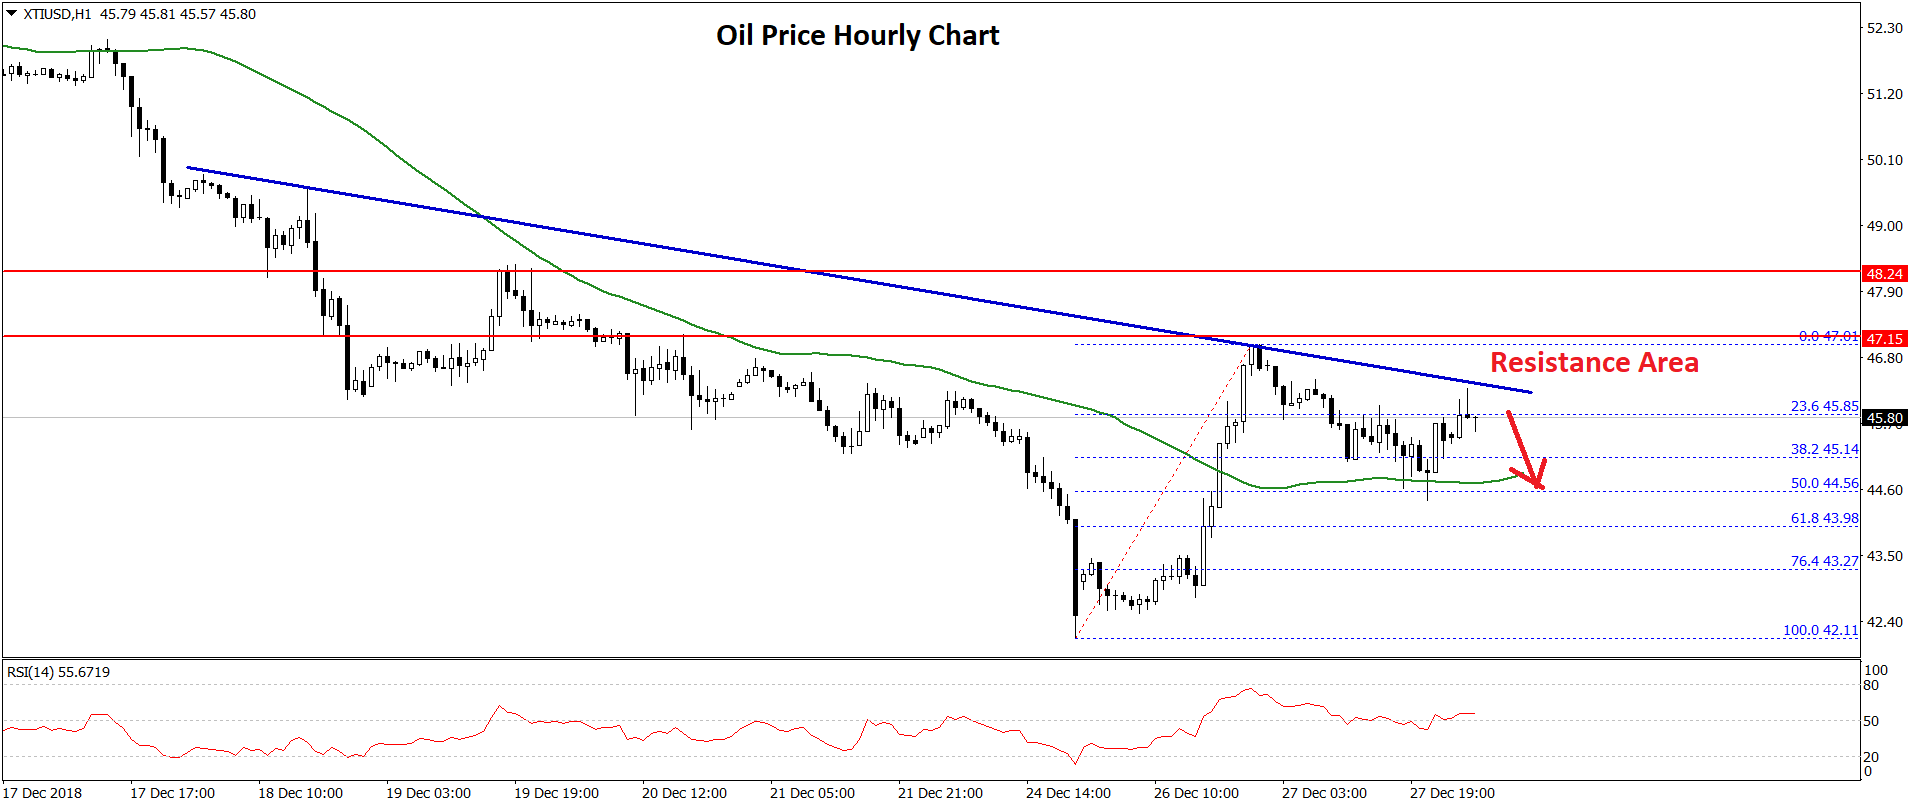
The price is moving lower and it already broke the $45.00 support plus the 38.2% Fib retracement level of the recent wave from the $42.11 low to $47.01 high. If the price continues to move down, there could be more losses below the $43.00 support.
An intermediate support is near the $43.20 and the 76.4% Fib retracement level of the recent wave from the $42.11 low to $47.01 high. Any further losses are likely to lead the price towards the $42.00 and $40.00 levels.
The overall market sentiment is still bearish for crude oil and it seems like there could be a downside extension below the $44.00 and $43.00 support levels. On the upside, the main barrier for buyers is near the $46.00 and $47.00 levels, above which there could be the start of an upward move.
Trade over 50 forex markets 24 hours a day with FXOpen. Take advantage of low commissions, deep liquidity, and spreads from 0.0 pips. Open your FXOpen account now or learn more about trading forex with FXOpen.
This article represents the opinion of the Companies operating under the FXOpen brand only. It is not to be construed as an offer, solicitation, or recommendation with respect to products and services provided by the Companies operating under the FXOpen brand, nor is it to be considered financial advice.
Latest from Forex Analysis
Latest articles

Look East! An Exciting Insight into FXOpen's New Hong Kong-listed Stock CFDs
Hong Kong has built up a gilt-edged reputation as one of the world's most reputable financial market centres. The city of Hong Kong enjoyed a unique position for many years. It is situated in the Asia Pacific region, very close

AUD/USD Rises Sharply on Inflation News
The Consumer Price Index for Australia was released this morning. According to ForexFactory:
→ CPI in quarterly terms: actual = 1.0%, expected = 0.8%, previous value = 0.6%;
→ CPI in annual terms: actual = 3.5%, expected = 3.4%, previous value = 3.

TSLA Share Price Up About 13% Despite Disappointing Report
Yesterday, TSLA trading closed at USD 144.68 per share, after which Tesla reported its results for the 1st quarter:
→ earnings per share: actual = USD 0.45, forecast = USD 0.49;
→ gross income: actual = USD 21.45 billion, forecast = USD