


FXOpen
GBP/USD is currently correcting lower towards the 1.3400 support area. Similarly, EUR/GBP is approaching a major support near 0.8785 where buyers could emerge.
Important Takeaways for GBP/USD and EUR/GBP
- The British Pound is placed nicely in a bullish zone above the 1.3400 support.
- There is a crucial bullish trend line in place with support at 1.3395 on the hourly chart of GBP/USD.
- EUR/GBP is currently trading near a key bullish trend line with support at 0.8790 on the hourly chart.
- Today, Germany’s Industrial Production report for April 2018 will be released, forecast +2.8% YoY versus +3.2% previous.
GBP/USD Technical Analysis
The British Pound made a nice upside move this week and formed a bottom around 1.3260 against the US Dollar. The GBP/USD pair traded above a few important resistance levels such as 1.3300, 1.3350 and 1.3400.
The pair traded as high as 1.3470 before sellers appeared. Later, a fresh downside move was initiated and the pair moved below the 1.3440 support level. There was even a spike below the 1.3400 handle before buyers appeared and protected further slides.
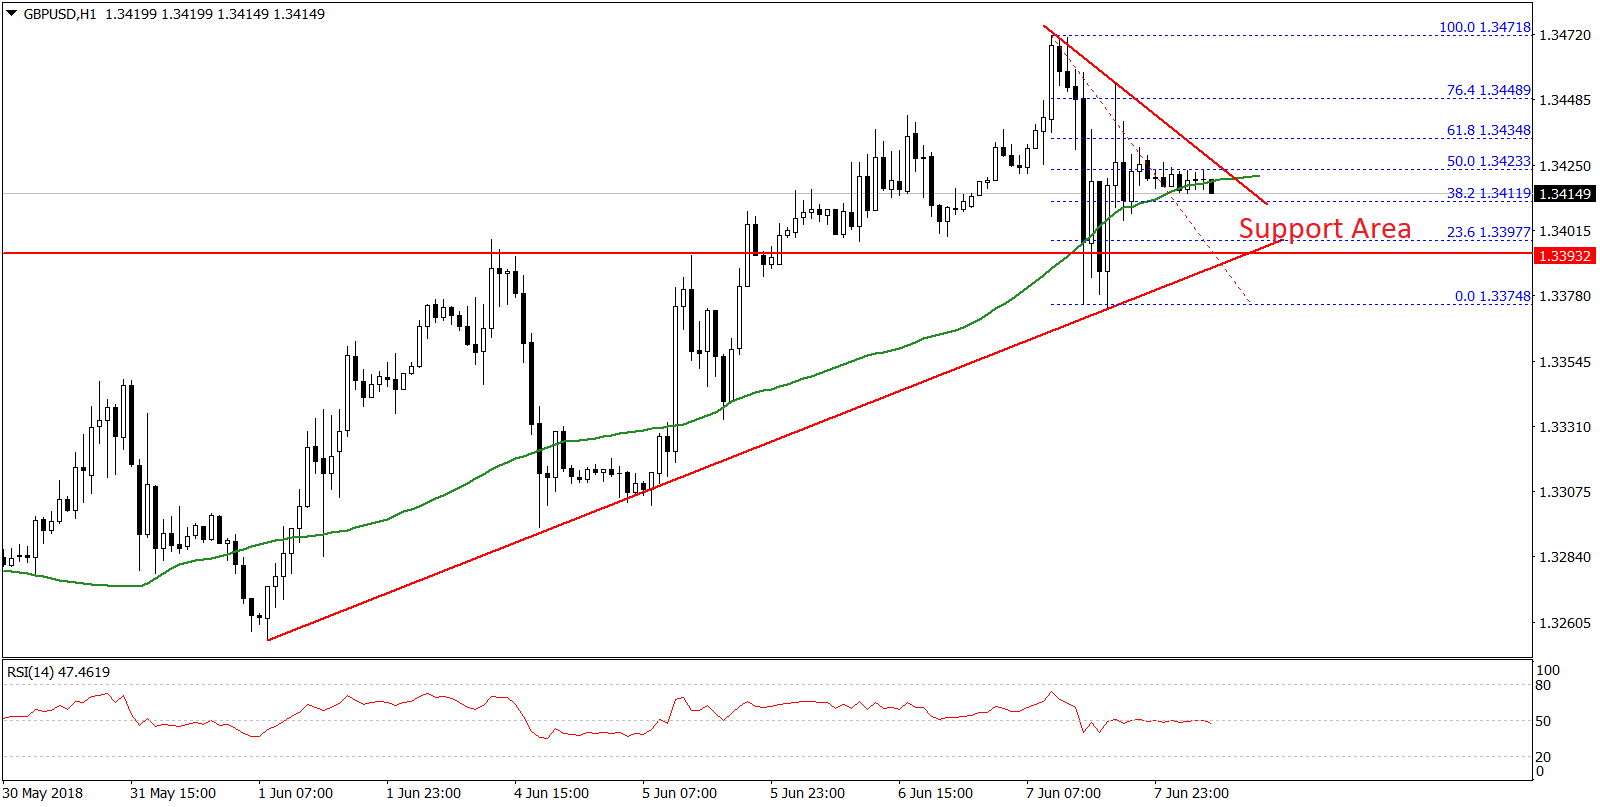
A low was formed at 1.3374 with a bounce above the 38.2% Fib retracement level of the last decline from the 1.3471 high to 1.3374 low. However, the upside move was capped by the 50 hourly simple moving average and 1.3440.
Moreover, the 50% Fib retracement level of the last decline from the 1.3471 high to 1.3374 low also acted as a resistance. It seems like the pair is consolidating above the 1.3400 support and a bullish trend line with support at 1.3395 on the hourly chart.
As long as the pair is above the 1.3400 support, there could be an upside break above the 1.3440 resistance. On the downside, a break below the 1.3395 level may perhaps push the pair towards the 1.3350 level.
EUR/GBP Technical Analysis
The Euro gained traction versus the British Pound this week and surged above the 0.8800 resistance. The EUR/GBP pair traded towards the 0.8840 level and formed a high at 0.8837.
Later, a downside correction was initiated, and the pair moved below the 0.8810 support. There was also a break below the 23.6% Fib retracement level of the last wave from the 0.8727 low to 0.8837 high.
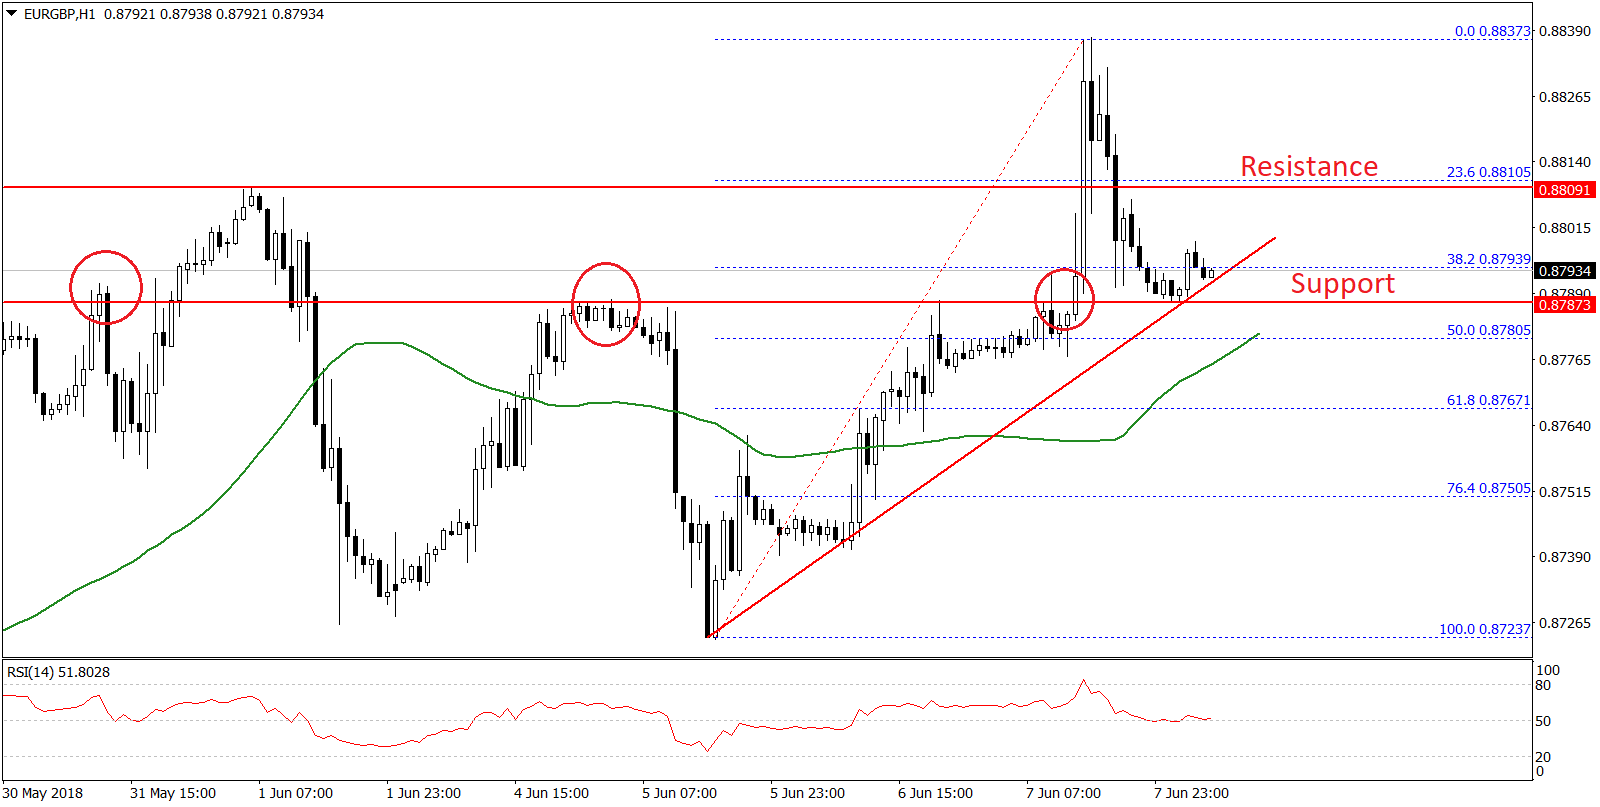
However, the pair is currently trading near a key bullish trend line with support at 0.8790 on the hourly chart. Below the trend line support, the 50% Fib retracement level of the last wave from the 0.8727 low to 0.8837 high is likely to prevent declines below the 0.8780 level.
On the upside, the broken support at 0.8810 may perhaps act as a resistance if the pair moves higher. Above this, EUR/GBP will most likely resume its uptrend above the 0.8840 level in the near term.
The overall bias is positive as long as the pair is above the 0.8780 level. Below this, the bias could turn bearish with the next major supports on the downside at 0.8760 and 0.8750.
Trade over 50 forex markets 24 hours a day with FXOpen. Take advantage of low commissions, deep liquidity, and spreads from 0.0 pips. Open your FXOpen account now or learn more about trading forex with FXOpen.
This article represents the opinion of the Companies operating under the FXOpen brand only. It is not to be construed as an offer, solicitation, or recommendation with respect to products and services provided by the Companies operating under the FXOpen brand, nor is it to be considered financial advice.
Latest from Forex Analysis
Latest articles

Weekly Market Wrap With Gary Thomson: UK100, USD, GOLD, OIL
Get the latest scoop on the week's hottest headlines, all in one convenient video. Join Gary Thomson, the COO of FXOpen UK, as he breaks down the most significant news reports and shares his expert insights.
- UK100 Share Index Rises

What Is a Darvas Box Theory and How Does It Work in Trading?
The Darvas Box Theory, pioneered by Nicolas Darvas in the 1950s, has transcended its stock market origins to become a valuable tool for forex traders. This method leverages specific price movements and patterns, known as the Darvas Box, to track

NFLX Stock Price Falls Despite Subscriber Growth
Yesterday, after the close of the main trading session on the stock market, Netflix reported to investors for the 1st quarter of 2024.
The report turned out better than expected:
→ earnings per share: actual = USD 5.28, forecast = USD 4.