


FXOpen
GBP/USD declined recently and tested the 1.3010 support before recovering. USD/CAD is currently correcting lower, but dips remain supported near 1.3070.
Important Takeaways for GBP/USD and USD/CAD
- The British Pound traded close to the 1.3000 support and it is currently recovering.
- There is a major bearish trend line in place with resistance near 1.3090 on the hourly chart of GBP/USD.
- USD/CAD is placed nicely above the 1.3080 and 1.3070 support levels.
- There is also a key bullish trend line formed with support at 1.3070 on the hourly chart.
GBP/USD Technical Analysis
The British Pound failed on many occasions to clear the 1.3240-1.3250 resistance area against the US Dollar. The GBP/USD pair started a fresh downside move and broke the 1.3120 and 1.3080 support levels.
There were heavy losses as the pair even closed below the 1.3100 level and the 50 hourly simple moving average. It traded close to the 1.3000 support area and formed a low at 1.3011.
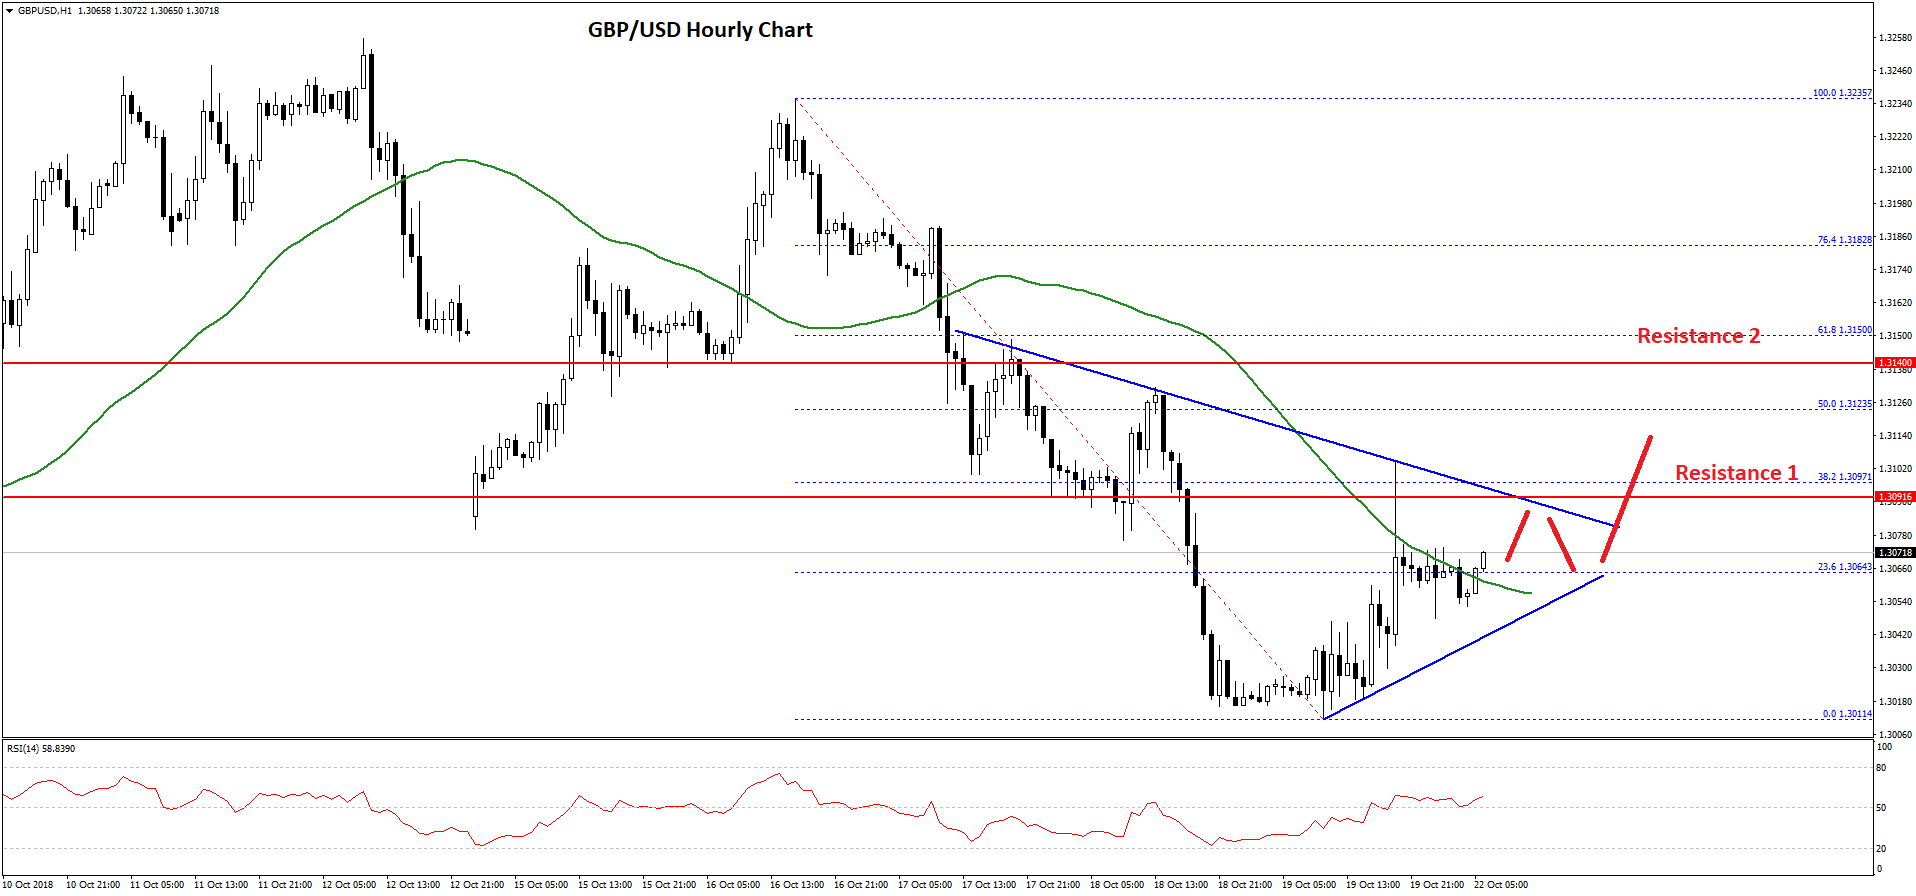
Later, the pair started a decent recovery and traded above the 1.3050 level. There was a break above the 23.6% Fib retracement level of the last decline from the 1.3235 high to 1.3011 low. The pair also traded above the 1.3080 level once and the 50 hourly SMA.
However, there is a strong resistance formed near the 1.3100 level. Moreover, there is a major bearish trend line in place with resistance near 1.3090 on the hourly chart.
Besides, the 38.2% Fib retracement level of the last decline from the 1.3235 high to 1.3011 low is also near 1.3095. Therefore, if the pair continues to move higher, it is likely to find a strong selling interest near the 1.3070 or 1.3090 levels.
Above 1.3090 or 1.3100, the pair is likely to recover further towards the 1.3120 or 1.3140 levels. On the flip side, if the pair breaks down and fails to recover above 1.3100, it could decline back towards the 1.3000 support area.
USD/CAD Technical Analysis
The US Dollar started a nasty upside move from the 1.2920 support area against the Canadian Dollar. The USD/CAD pair climbed higher and broke the 1.2980 and 1.3000 resistance levels.
The upside move was such that the pair even broke the 1.3050 resistance and settled above the 50 hourly simple moving average. Buyers pushed the pair above the 1.3120 level and a high was formed near the 1.3132 level.
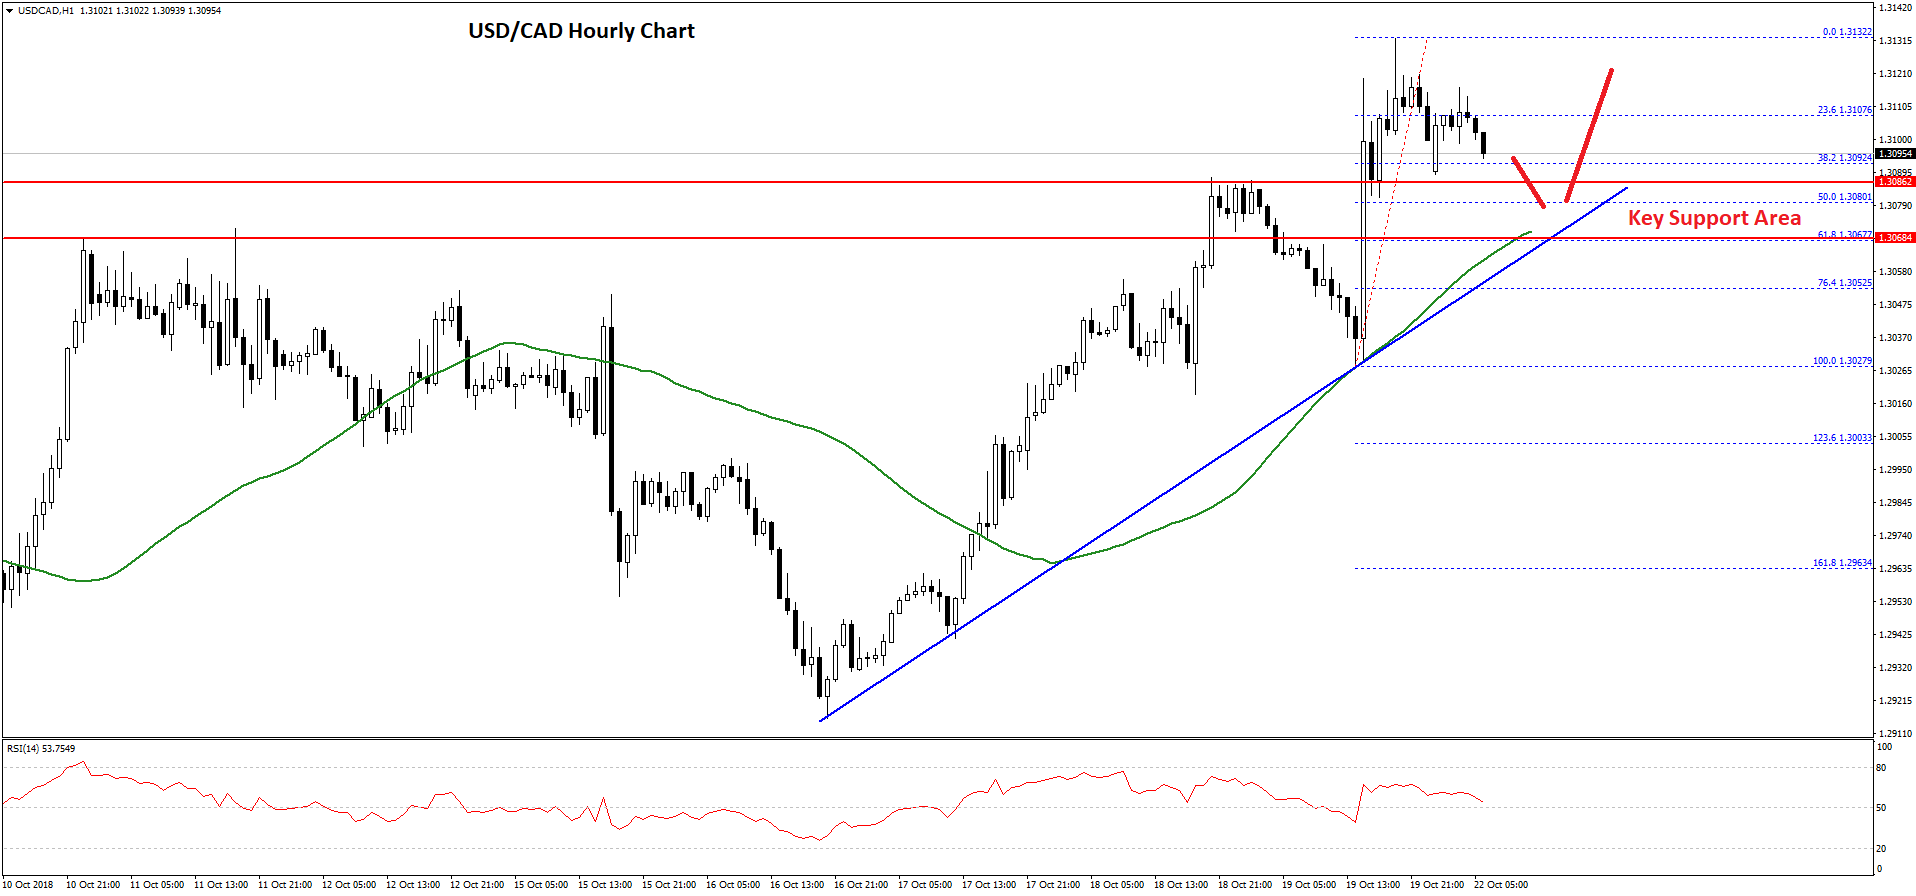
Later, the pair started a downside correction and the pair traded below the 1.3100. There was also a break below the 23.6% Fib retracement level of the last wave from the 1.3027 low to 1.3132 high.
However, the pair remains in a solid uptrend since there are many supports near the 1.3080 and 1.3070 levels. There is also a key bullish trend line formed with support at 1.3070 on the hourly chart.
Moreover, the 50% Fib retracement level of the last wave from the 1.3027 low to 1.3132 high is positioned near the 1.3080 level. Therefore, dips from the current levels towards the 1.3080 and 1.3070 levels are likely to find a strong buying interest.
Below 1.3070, the pair could extend the downside correction towards the 1.3027 swing low or the 1.3010 level. On the upside, the pair must break the 1.3120 and 1.3130 resistances to climb towards the 1.3200 level in the near term.
Trade over 50 forex markets 24 hours a day with FXOpen. Take advantage of low commissions, deep liquidity, and spreads from 0.0 pips. Open your FXOpen account now or learn more about trading forex with FXOpen.
This article represents the opinion of the Companies operating under the FXOpen brand only. It is not to be construed as an offer, solicitation, or recommendation with respect to products and services provided by the Companies operating under the FXOpen brand, nor is it to be considered financial advice.
Latest from Forex Analysis
Latest articles

Since the Start of the Week, Brent Oil Price Has Dropped over 4%
At the beginning of the week, March 15, we wrote that the price of Brent oil could form a correction from the resistance level of USD 91 per barrel. Since then, the price has decreased by more than 4% due

Fair Value Gaps vs Liquidity Voids in Trading
Understanding fair value gaps and liquidity voids is essential for traders seeking to navigate the complexities of the financial markets. These concepts, deeply rooted in the Smart Money Concept (SMC), provide valuable insights into the dynamics of supply and demand,

UK100 Share Index Rises as UK Inflation Slows
Yesterday, the UK Office for National Statistics (ONS) reported that the CPI stood at 3.2% in March. According to ForexFactory, analysts expected 3.1%, and a month ago the index was 3.4%.
Grant Fitzner, chief economist at the