


FXOpen

GBP/USD started a major decline from well above 1.2260 and broke the 1.2200 support. USD/CAD is moving higher, but it is facing a strong resistance near 1.3330.
Important Takeaways for GBP/USD and USD/CAD
- The British Pound is declining and it broke the key 1.2200 and 1.2180 support levels.
- There is a major declining channel forming with resistance near 1.2180 on the hourly chart of GBP/USD.
- USD/CAD is slowly moving higher towards the 1.3330 and 1.3340 resistance levels.
- There is a connecting bullish trend line forming with support near 1.3260 on the hourly chart.
GBP/USD Technical Analysis
The British Pound failed to settle above the 1.2300 resistance level against the US Dollar. As a result, the GBP/USD pair started a steady decline and broke the 1.2250 and 1.2200 support levels.
Moreover, there was a close below the 1.2200 support level and the 50 hourly simple moving average. Finally, the pair even broke the 1.2180 and 1.2150 support levels. A swing low was formed near 1.2136 on FXOpen and the pair is currently correcting higher.
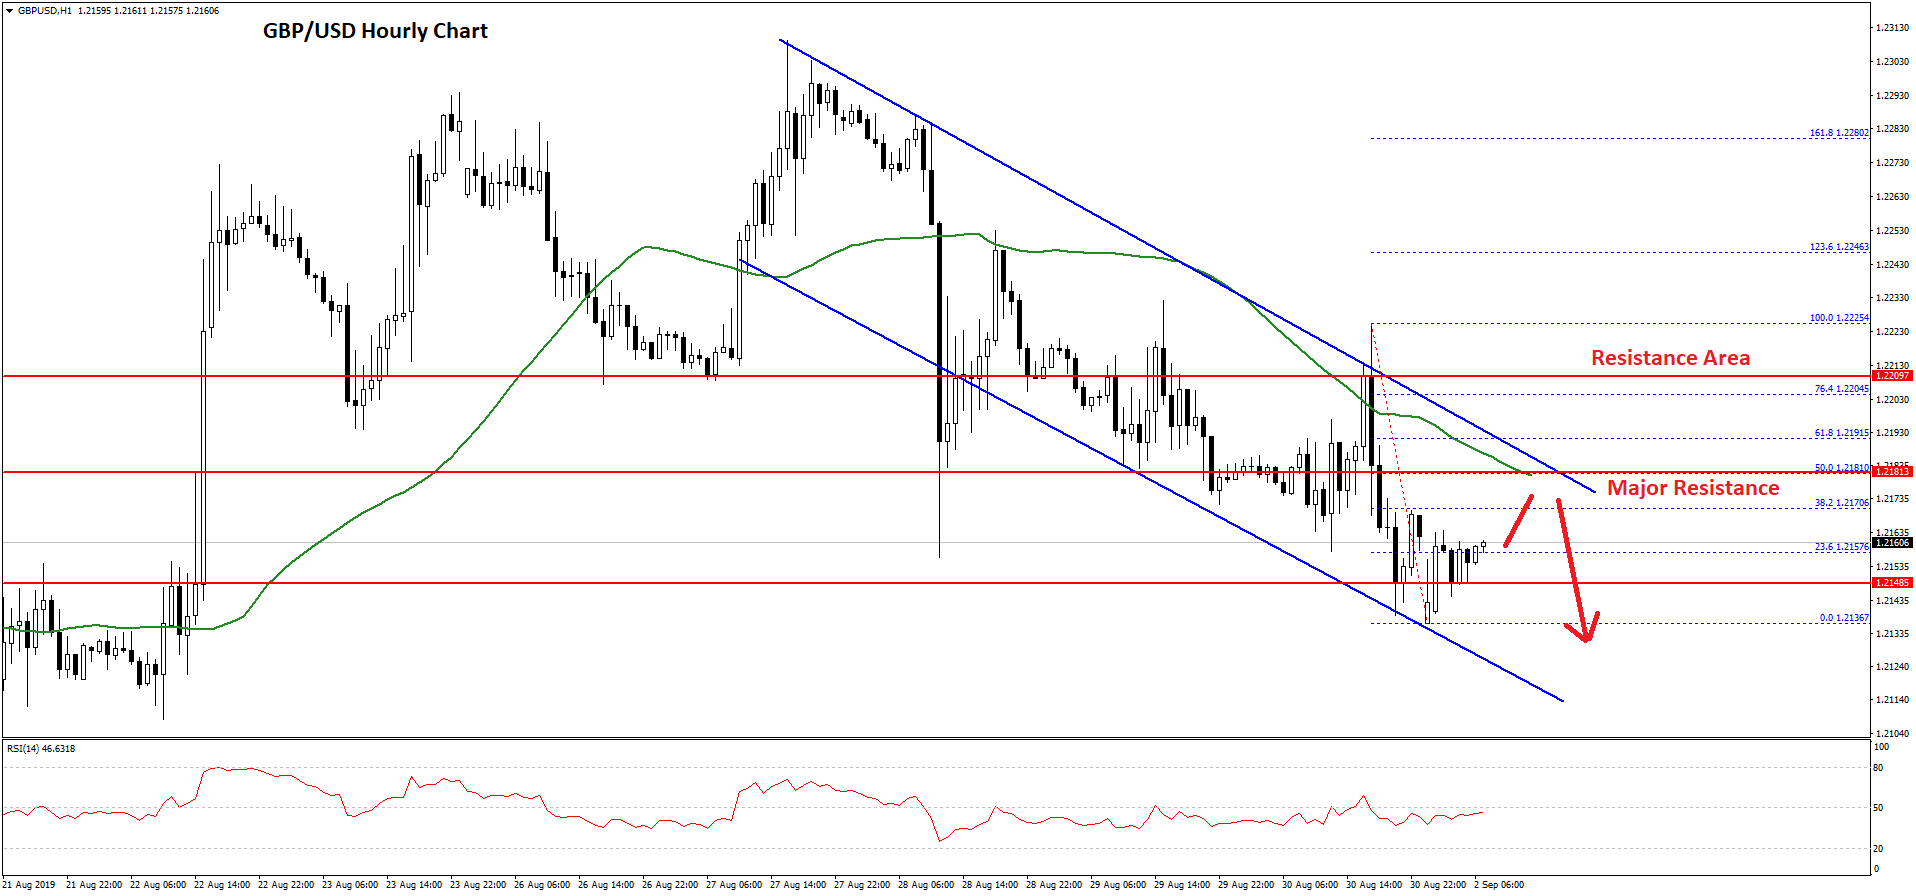
It is trading above 1.2150 plus the 23.6% Fib retracement level of the recent slide from the 1.2225 high to 1.2136 low. However, there are many hurdles on the upside near the 1.2180 level and the 50 hourly simple moving average.
Moreover, there is a major declining channel forming with resistance near 1.2180 on the hourly chart of GBP/USD. The trend line coincides with the 50 hourly simple moving average.
The 50% Fib retracement level of the recent slide from the 1.2225 high to 1.2136 low is also near the 1.2180 level to act as a resistance. Therefore, the pair is likely to face a strong resistance near 1.2180.
The next key resistance is at 1.2200, above which the pair could start a decent recovery in the coming sessions. Conversely, if the pair fails to move above the 1.2180 or 1.2200 resistance, it could continue to decline.
An immediate support is near the 1.2140 level, below which GBP/USD might decline towards the 1.2100 support level in the near term.
USD/CAD Technical Analysis
The US Dollar remained in a positive zone above the 1.3250 and 1.3260 support levels against the Canadian Dollar. The USD/CAD pair even settled above the 1.3260 pivot level to move into a positive zone.
Recently, there was a break above the 1.3300 resistance and the 50 hourly simple moving average. However, the pair is still struggling to break the key 1.3330 and 1.3340 resistance levels.
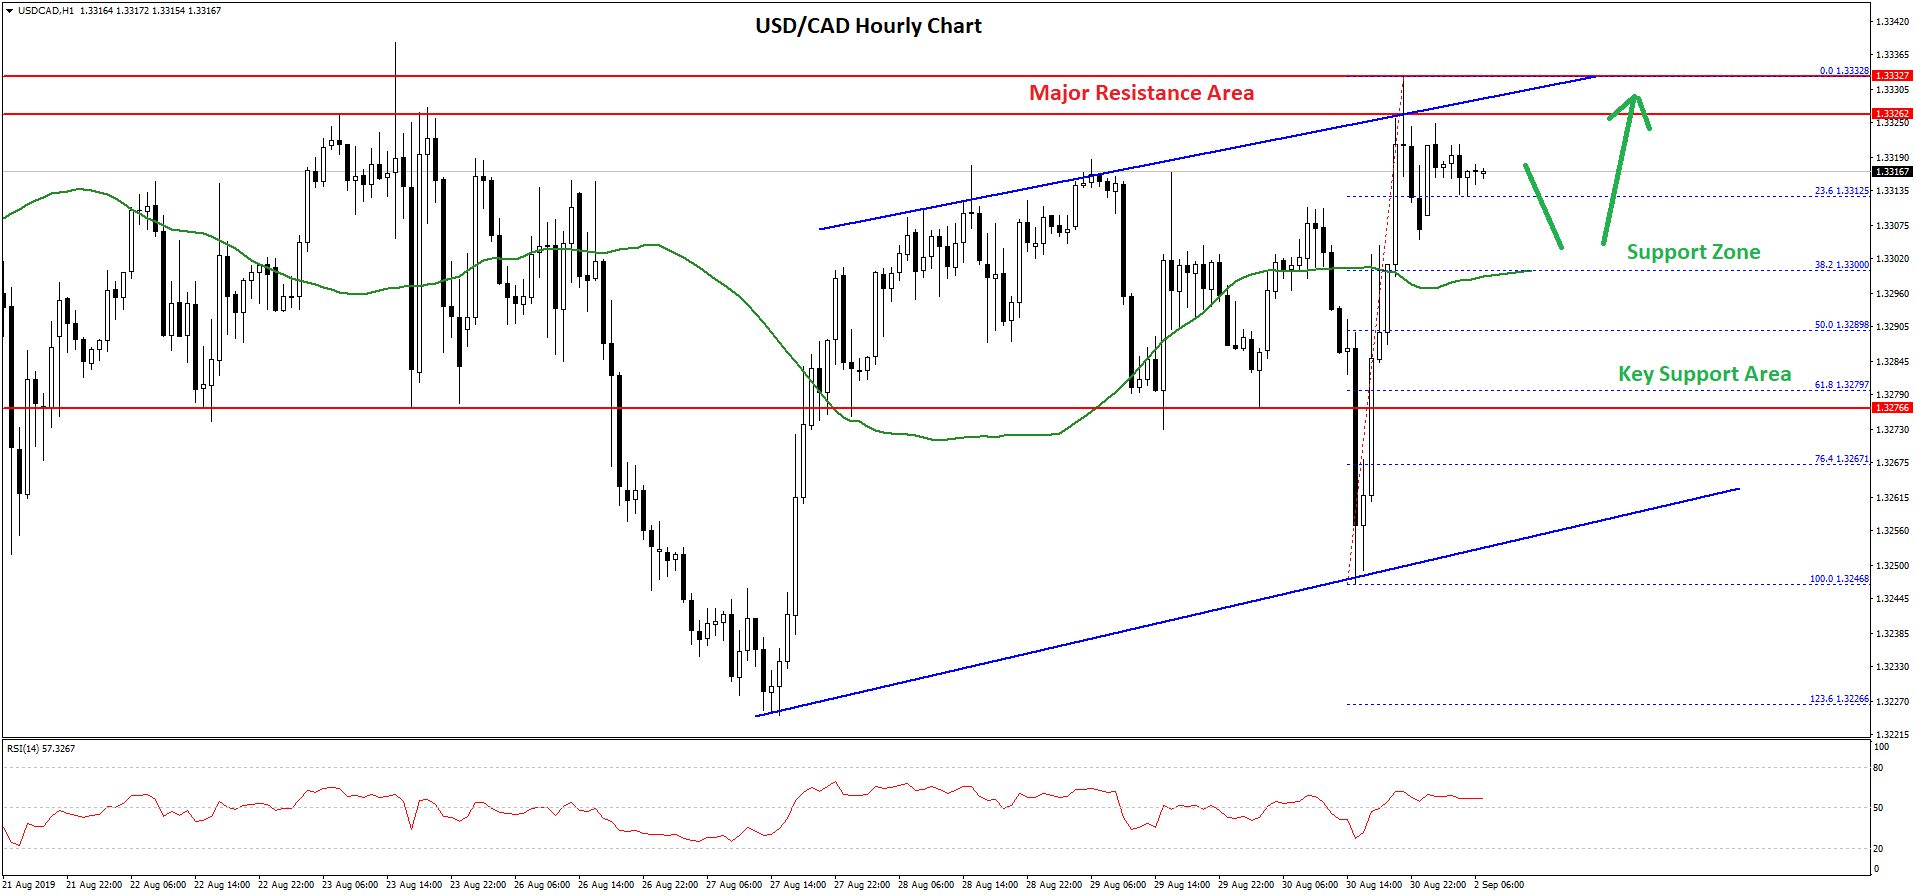
The recent high was formed near 1.3332 and the pair is currently correcting lower. It already tested the 23.6% Fib retracement level of the recent wave from the 1.3246 low to 1.3332 high.
On the downside, there are a few key supports near the 1.3300 level and the 50 hourly simple moving average. The next major support is near the 1.3280 level. An intermediate support is near the 1.3290 level plus the 50% Fib retracement level of the recent wave from the 1.3246 low to 1.3332 high.
Moreover, there is a connecting bullish trend line forming with support near 1.3260 on the hourly chart. Therefore, the pair is likely to find many supports, starting with 1.3300 and up to 1.3260.
On the upside, USD/CAD must break the 1.3330 and 1.3340 resistance levels to continue higher towards the 1.3400 resistance in the coming sessions.
Trade over 50 forex markets 24 hours a day with FXOpen. Take advantage of low commissions, deep liquidity, and spreads from 0.0 pips. Open your FXOpen account now or learn more about trading forex with FXOpen.
This article represents the opinion of the Companies operating under the FXOpen brand only. It is not to be construed as an offer, solicitation, or recommendation with respect to products and services provided by the Companies operating under the FXOpen brand, nor is it to be considered financial advice.
Latest from Forex Analysis
Latest articles

Weekly Market Wrap With Gary Thomson: UK100, USD, GOLD, OIL
Get the latest scoop on the week's hottest headlines, all in one convenient video. Join Gary Thomson, the COO of FXOpen UK, as he breaks down the most significant news reports and shares his expert insights.
- UK100 Share Index Rises

What Is a Darvas Box Theory and How Does It Work in Trading?
The Darvas Box Theory, pioneered by Nicolas Darvas in the 1950s, has transcended its stock market origins to become a valuable tool for forex traders. This method leverages specific price movements and patterns, known as the Darvas Box, to track

NFLX Stock Price Falls Despite Subscriber Growth
Yesterday, after the close of the main trading session on the stock market, Netflix reported to investors for the 1st quarter of 2024.
The report turned out better than expected:
→ earnings per share: actual = USD 5.28, forecast = USD 4.