


FXOpen
GBP/USD remained well bid above the 1.2800 area and recently started a fresh increase above 1.2875. USD/CAD topped near the 1.3200 area and it is currently correcting lower.
Important Takeaways for GBP/USD and USD/CAD
- The British Pound jumped higher recently above the 1.2875 and 1.2900 resistance levels.
- There is a connecting bullish trend line forming with support near 1.2920 on the hourly chart of GBP/USD.
- USD/CAD started a downside correction after trading as high as 1.3207.
- There is a declining channel forming with support near 1.3125 on the hourly chart.
GBP/USD Technical Analysis
After a downside correction, the British Pound found support near the 1.2800 area against the US Dollar. The GBP/USD pair formed a support base near 1.2810 and started a fresh increase.
The pair broke a few important resistances near the 1.2850 level to move into a positive zone. Moreover, there was a break above the 1.2880 barrier and the 50 hourly simple moving average. Finally, the pair climbed above the 1.2900 level and traded as high as 1.2975 on FXOpen.
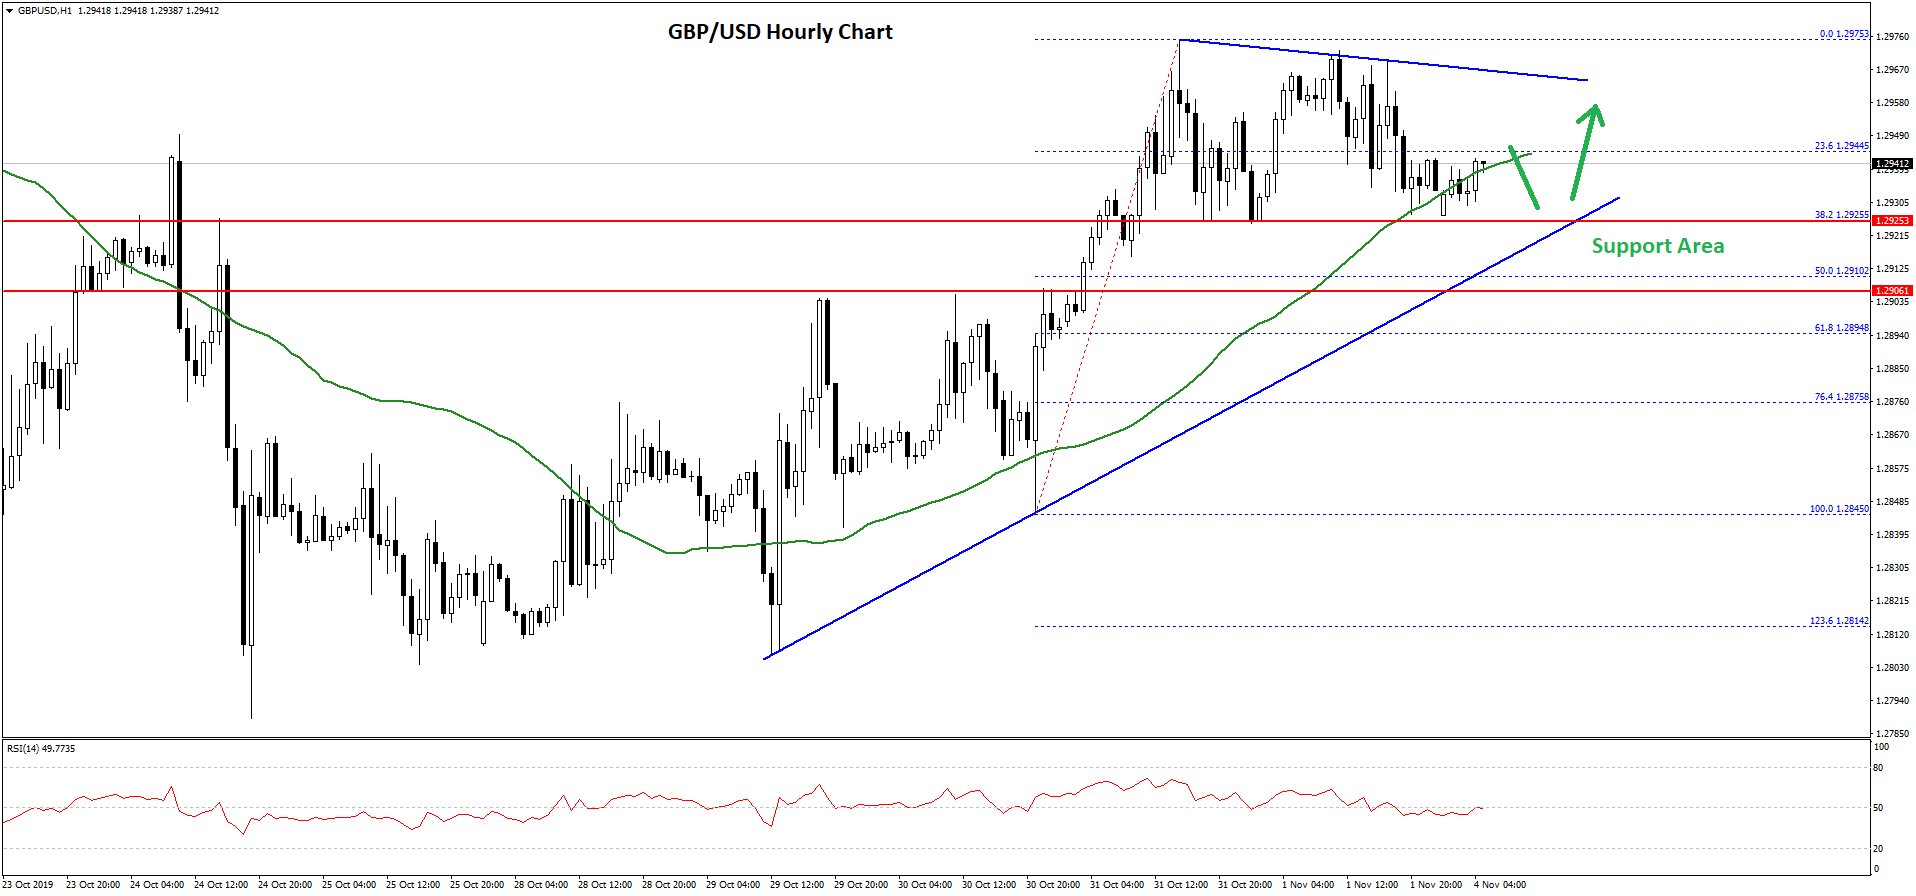
Recently, there was a minor downside correction below the 1.2950 level. The pair traded below the 23.6% Fib retracement level of the recent wave from the 1.2845 swing low to 1.2975 high.
However, the 1.2925 level is acting as a support and the pair is currently trading near the 50 hourly simple moving average. On the downside, there are many supports near the 1.2925 and 1.2920 levels.
Moreover, there is a connecting bullish trend line forming with support near 1.2920 on the hourly chart of GBP/USD. If there is a break below the trend, the pair could test the 1.2900 support area.
An intermediate support is near the 50% Fib retracement level of the recent wave from the 1.2845 swing low to 1.2975 high.
On the upside, an immediate resistance is near the 1.2970 level. If there is an upside break above 1.2970 and 1.2975, GBP/USD could accelerate above the 1.3000 resistance.
USD/CAD Technical Analysis
The US Dollar rallied sharply from the 1.3042 low against the Canadian Dollar. The USD/CAD pair traded above the 1.3100 and 1.3180 resistance levels to move into a positive zone.
However, the pair failed to surpass the 1.3200-1.3210 resistance and traded as high as 1.3207. Recently, it started a downside correction below the 1.3200 and 1.3180 levels.
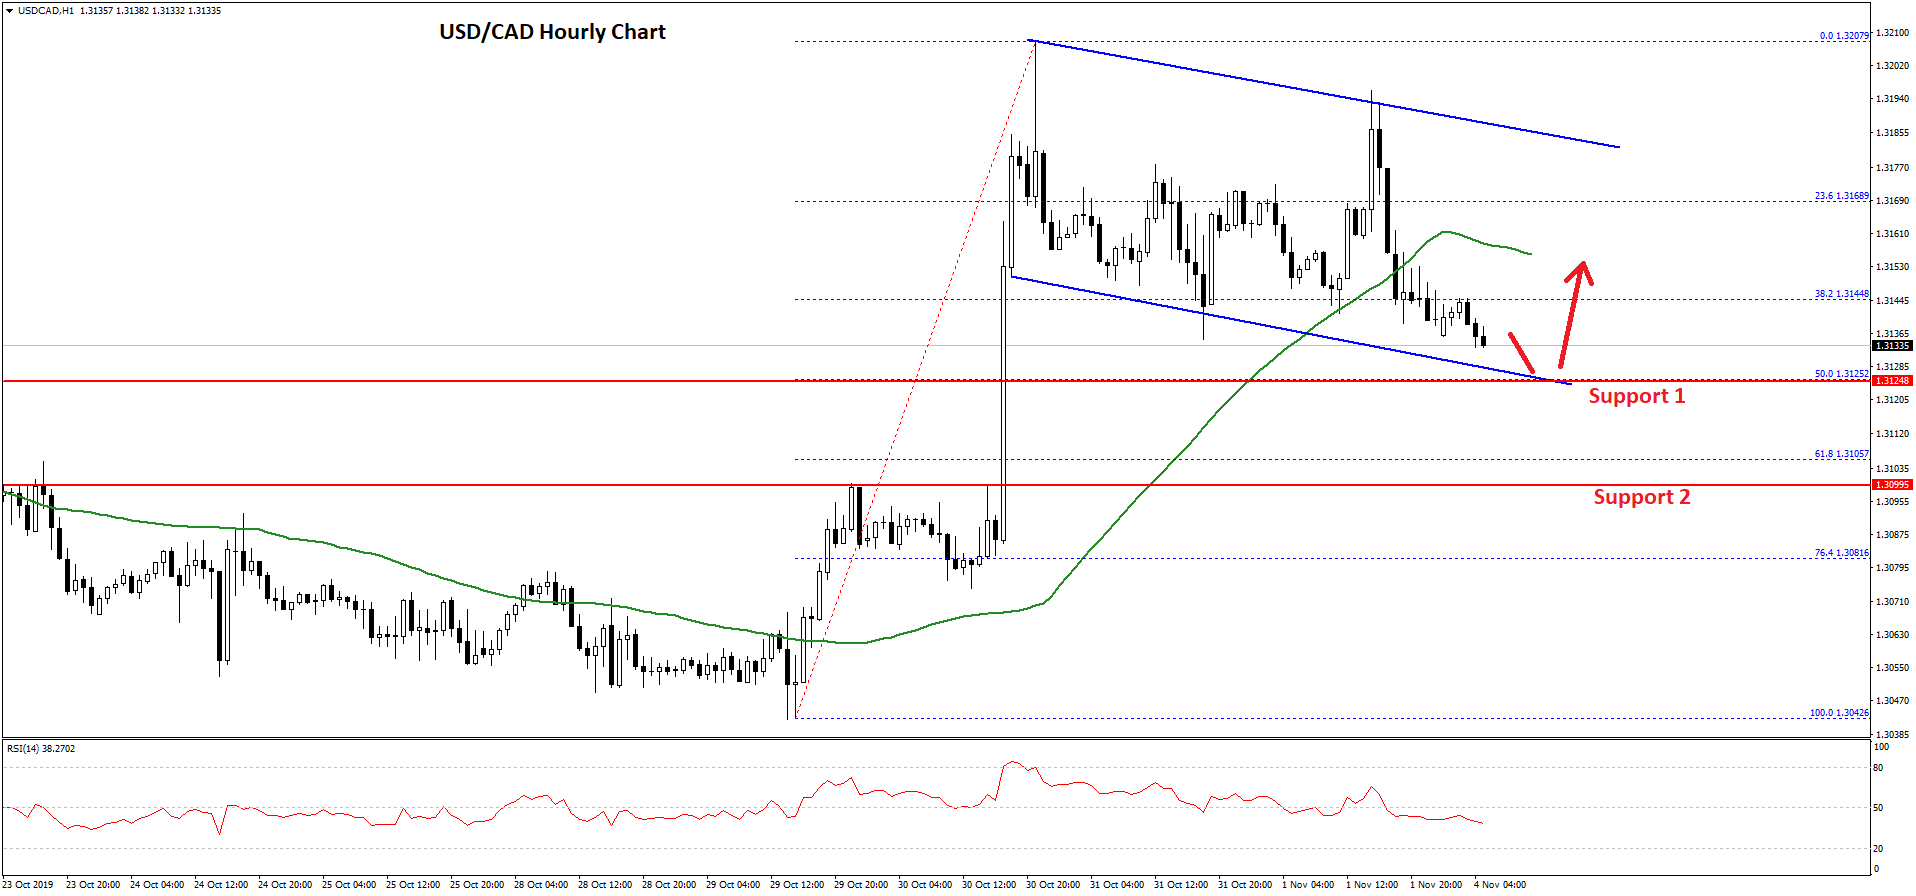
There was a break above the 1.3150 support level and the 50 hourly simple moving average. Additionally, the pair traded below the 23.6% Fib retracement level of the last wave from the 1.3042 swing low to 1.3207 high.
On the downside, there is a strong support waiting near the 1.3125 level. It coincided with the 50% Fib retracement level of the last wave from the 1.3042 swing low to 1.3207 high.
More importantly, there is a declining channel forming with support near 1.3125 on the hourly chart. If there is a downside break below the 1.3125 support area, there could be more downsides towards the 1.3100 support area.
Conversely, if there is an upward move, USD/CAD might face resistance near the 1.3150 level and the 50 hourly SMA. The main resistance on the upside is near the 1.3180 level, above which the pair could continue to rise towards 1.3200 and 1.3220 in the coming sessions.
Trade over 50 forex markets 24 hours a day with FXOpen. Take advantage of low commissions, deep liquidity, and spreads from 0.0 pips. Open your FXOpen account now or learn more about trading forex with FXOpen.
This article represents the opinion of the Companies operating under the FXOpen brand only. It is not to be construed as an offer, solicitation, or recommendation with respect to products and services provided by the Companies operating under the FXOpen brand, nor is it to be considered financial advice.
Latest from Forex Analysis
Latest articles

What Order Imbalance Is and How To Use It in a Trading Strategy
Understanding the nuances of order imbalances is key for traders looking to navigate the ebb and flow of asset prices. Order imbalances provide a clear window into the supply and demand dynamics at play, offering strategic insights. This article delves

XAU/USD Gold Price Reaches an Important Resistance Zone
The XAU/USD gold chart today indicates that the historical record price of the metal is above USD 2,400 per ounce.
In addition to fears of a new round of inflation due to rising commodity prices, geopolitical tensions are

What Is a Break of Structure and How Can You Trade It?
In the ever-evolving world of Smart Money Concept (SMC) trading, a nuanced understanding of market dynamics is indispensable. This article explores the concept of Break of Structure (BOS), how to identify it, and its implications for trading strategies, setting traders