


FXOpen

GBP/USD started an upside correction from 1.2200 and traded above the 1.2300 resistance. USD/CAD is currently accelerating higher and it could soon break the 1.3340 resistance area.
Important Takeaways for GBP/USD and USD/CAD
- The British Pound is currently recovering and is trading above the 1.2300 resistance.
- There is a major bullish trend line forming with support near 1.2300 on the hourly chart of GBP/USD.
- USD/CAD is currently trading nicely above the 1.3280 and 1.3300 resistance levels.
- There is a major declining channel or a bullish flag forming with resistance near 1.3330 on the hourly chart.
GBP/USD Technical Analysis
The British Pound formed a decent support base near the 1.2200 level against the US Dollar. As a result, the GBP/USD pair started an upside correction above the 1.2250 and 1.2300 resistance levels.
The pair even climbed above the 1.2350 resistance area and the 50 hourly simple moving average. Finally, the pair spiked above the 1.2400 level and traded as high as 1.2412 on FXOpen.
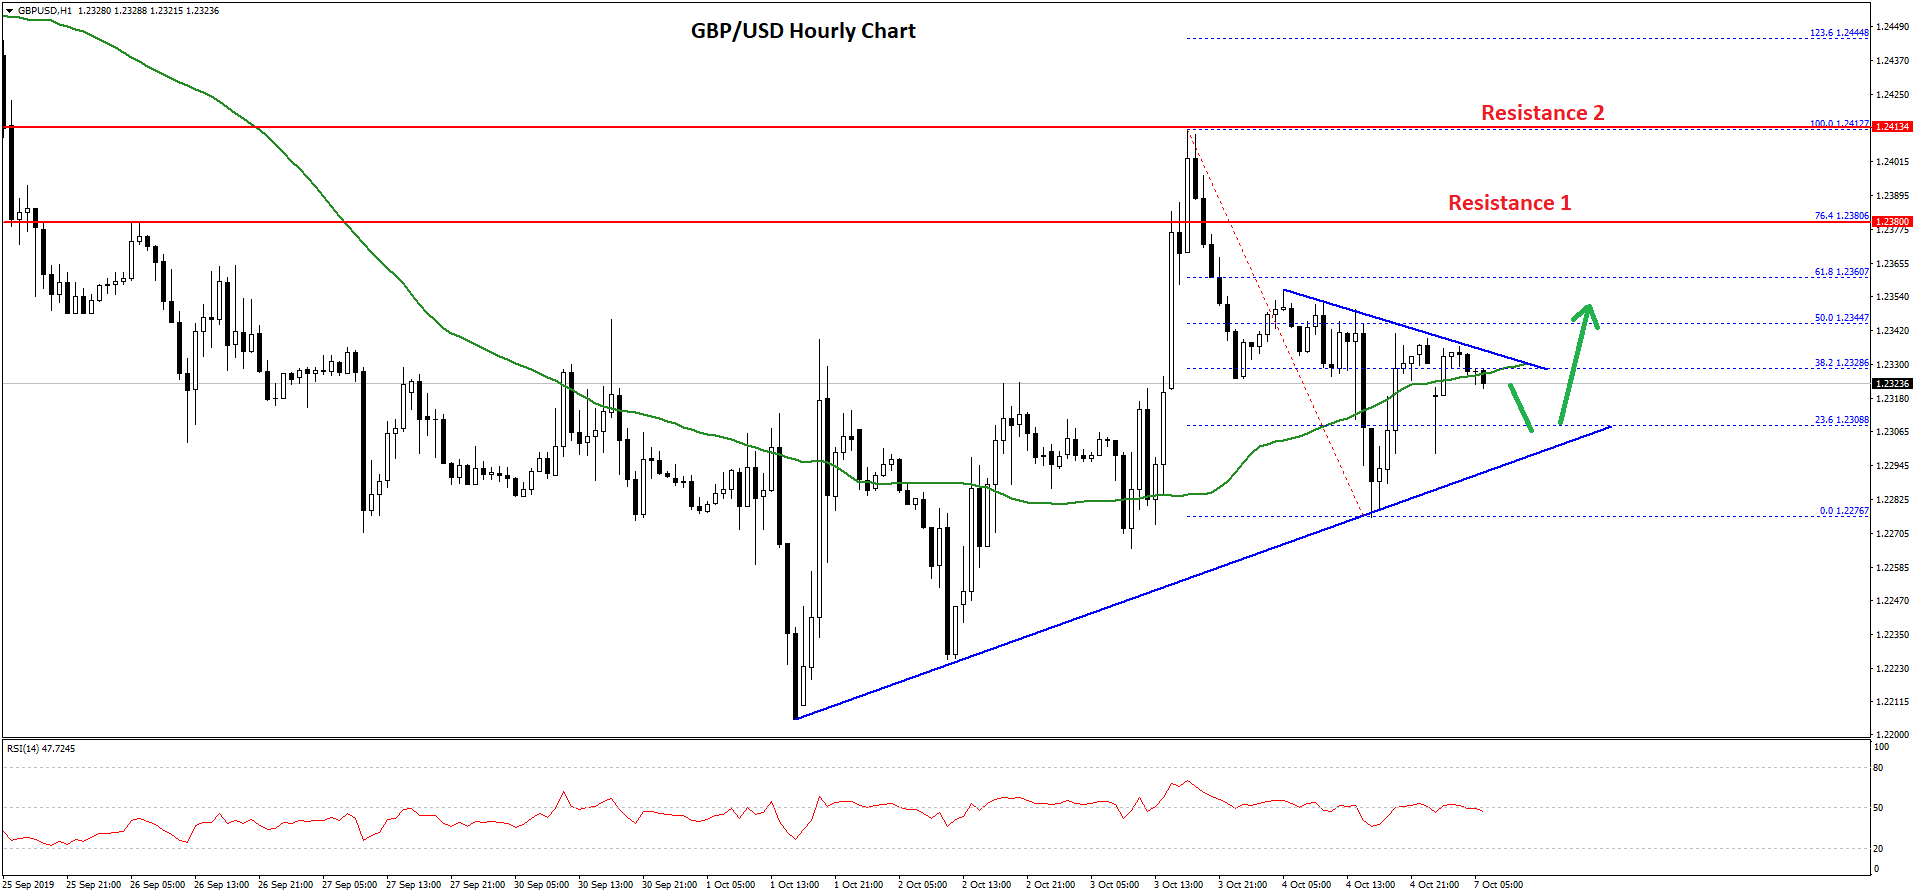
Recently, the pair corrected lower and traded below the 1.2400 and 1.2320 levels. It traded as low as 1.2276 and is currently climbing higher. There was a break above the 23.6% Fib retracement level of the last decline from the 1.2412 high to 1.2276 low.
The pair is now trading above the 1.2300 level and near the 50 hourly simple moving average. On the downside, there is a strong support forming near the 1.2300 level.
Moreover, there is a major bullish trend line forming with support near 1.2300 on the hourly chart of GBP/USD. If there is a downside break below the 1.2300 and 1.2280 support levels, the pair could resume its decline.
On the upside, the key resistance is near the 1.2330 and 1.2340 levels. A successful close above 1.2340 might push the pair towards the 1.2380 and 1.2400 resistance levels in the near term.
USD/CAD Technical Analysis
The US Dollar started a sharp rise from the 1.3200 support area against the Canadian Dollar. The USD/CAD pair broke the 1.3250 and 1.3280 resistance levels to move into a positive zone.
The pair even climbed the 1.3300 resistance and the 50 hourly simple moving average. Finally, the pair traded as high as 1.3347 and it is currently correcting gains. It traded below the 1.3320 support area.
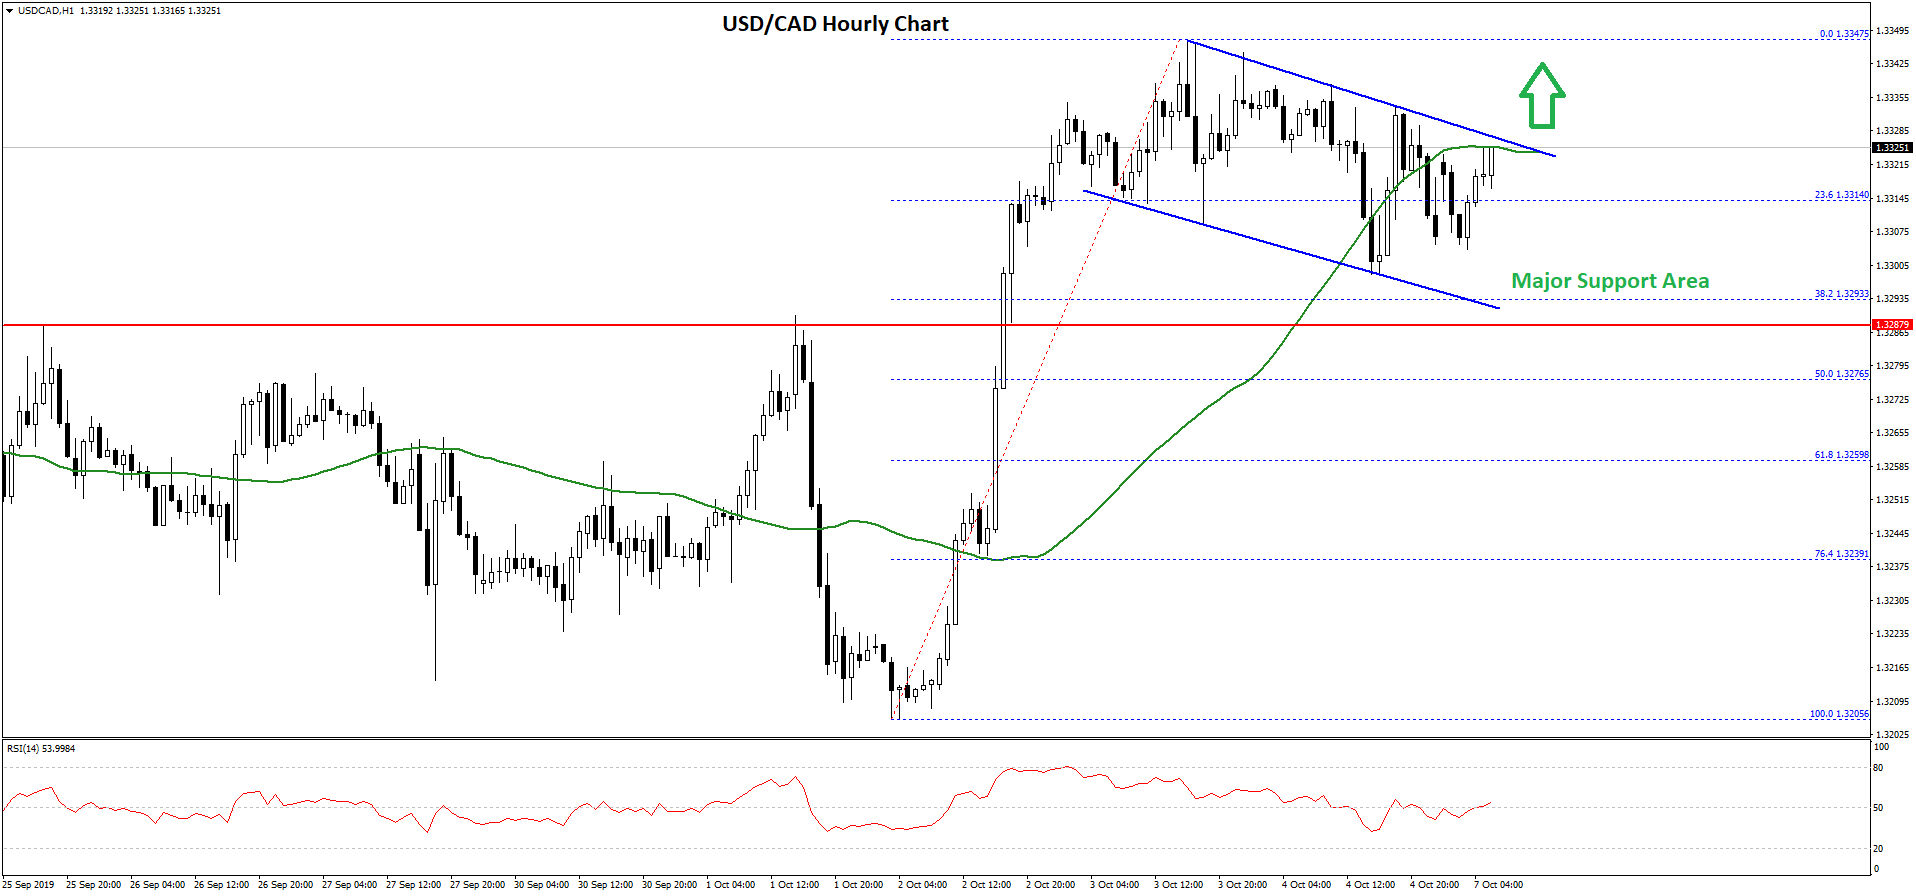
Moreover, there was a break below the 23.6% Fib retracement level of the last major wave from the 1.3205 low to 1.3347 high. However, the pair remained well bid above the 1.3300 support area and is trading with a positive bias.
On the downside, there is a strong support forming near 1.3300 and 1.3290. Besides, the 50% Fib retracement level of the last major wave from the 1.3205 low to 1.3347 high is near the 1.3290 level.
More importantly, there is a major declining channel or a bullish flag forming with resistance near 1.3330 on the hourly chart. The pair is currently trading near the channel resistance at 1.3325 and the 50 hourly SMA.
If there is a successful break above the 1.3330 and 1.3340 resistance levels, USD/CAD could accelerate higher towards the 1.3350 and 1.3375 resistance levels in the near term. Any further gains might lead the pair towards the 1.3400 level.
Trade over 50 forex markets 24 hours a day with FXOpen. Take advantage of low commissions, deep liquidity, and spreads from 0.0 pips. Open your FXOpen account now or learn more about trading forex with FXOpen.
This article represents the opinion of the Companies operating under the FXOpen brand only. It is not to be construed as an offer, solicitation, or recommendation with respect to products and services provided by the Companies operating under the FXOpen brand, nor is it to be considered financial advice.
Stay ahead of the market!
Subscribe now to our mailing list and receive the latest market news and insights delivered directly to your inbox.


Latest articles

Dollar Strengthens Following Fed Verdict
The USD/JPY and USD/CAD currency pairs are showing moderate gains following yesterday’s meeting of the US Federal Reserve. As expected, the American central bank kept its key interest rate unchanged. However, the tone of the accompanying statement

BTC/USD Analysis: Price Edges Close to the $100k Mark
Yesterday, the price of Bitcoin climbed above $99,000 – a level not seen since late February this year.
However, the bullish momentum proved insufficient to breach the psychological $100,000 barrier, and this morning the leading cryptocurrency is holding above

Alphabet (GOOGL) Shares Drop Over 7% in a Single Day
According to the Alphabet (GOOGL) stock chart, yesterday’s main trading session opened around $163.70 but then saw a sharp decline, hitting an intraday low of approximately $148 per share. By the close, bulls managed to recover only a