


FXOpen
GBP/USD rallied recently and broke the 1.3150 resistance zone. EUR/GBP declined heavily and traded below the 0.8700 support to move into a bearish zone.
Important Takeaways for GBP/USD and EUR/GBP
- The British Pound gained a lot of traction recently and traded above 1.3150 and 1.3200.
- There was a break above a major ascending channel with resistance at 1.3155 on the hourly chart of GBP/USD.
- EUR/GBP fell sharply and traded below the 0.8720 and 0.8700 support levels.
- There are two bearish trend lines in place with resistance near the 0.8660 and 0.8670 levels on the hourly chart.
GBP/USD Technical Analysis
The British Pound started a major uptrend from well below the 1.2800 pivot level against the US Dollar. The GBP/USD pair traded higher and broke the 1.3000 and 1.3100 resistance levels to move into a bullish zone.
The recent rise was sold as the pair broke the 1.3150 and 1.3200 resistance levels, and settled above the 50 hourly simple moving average. A new monthly high was formed at 1.3217 on FXOpen and the pair is clearly placed in a solid uptrend.
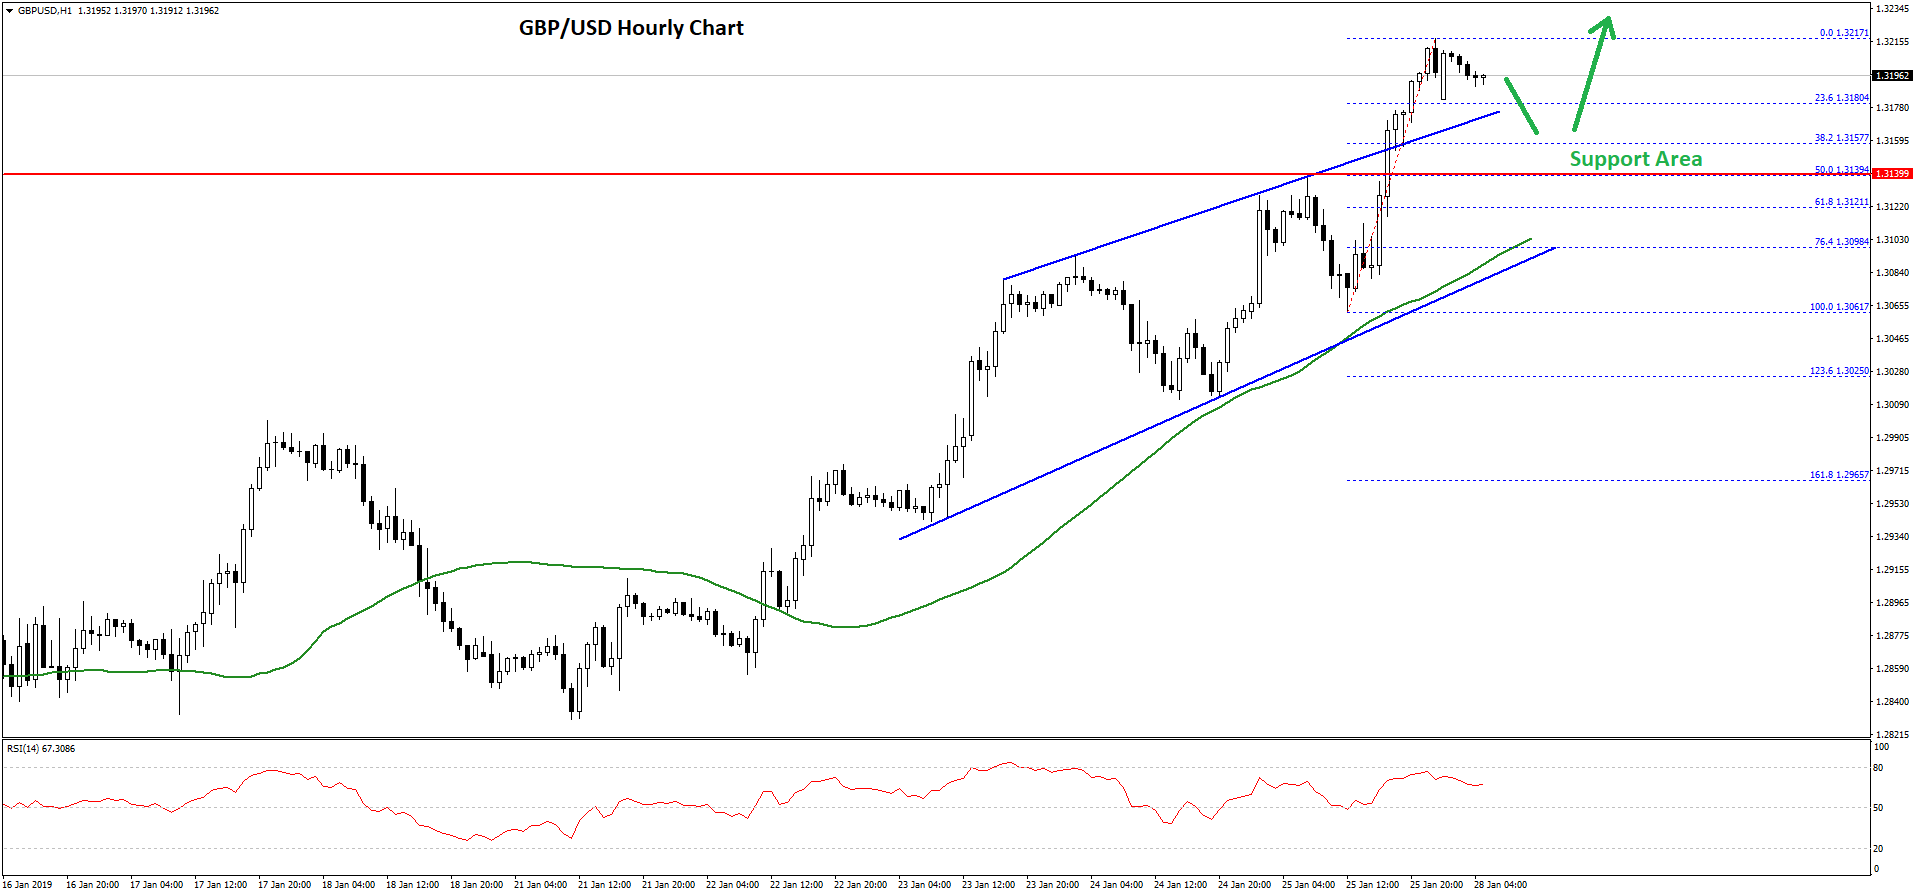
During the climb, there was a break above a major ascending channel with resistance at 1.3155 on the hourly chart of GBP/USD. The pair is currently correcting lower towards an initial support near the 23.6% Fib retracement level of the last wave from the 1.3061 low to 1.3217 high.
However, there are many supports on the downside near the 1.3175 and 1.3150 levels. Moreover, the broken channel resistance may now act as a solid support near 1.3160.
Besides, the 50% Fib retracement level of the last wave from the 1.3061 low to 1.3217 high is near the 1.3140 to act as a barrier for sellers. Therefore, if there is a downside correction, the pair is likely to find a lot of buying interest near 1.3160 or 1.3150.
Overall, GBP/USD remains well supported on dips if there is a downside extension towards 1.3140 level. On the upside, the main hurdles for buyers are near 1.3220 and 1.3250.
EUR/GBP Technical Analysis
The Euro started a major downward move from well above 0.8860 against the British Pound. The EUR/GBP pair declined below the 0.8750 and 0.8700 support levels to enter a downtrend.
The pair even broke the 0.8650 support and settled below the 50 hourly simple moving average. A low was formed at 0.8617 and later the pair corrected higher. It climbed above the 23.6% Fib retracement level of the recent decline from the 0.8724 high to 0.8617 low.
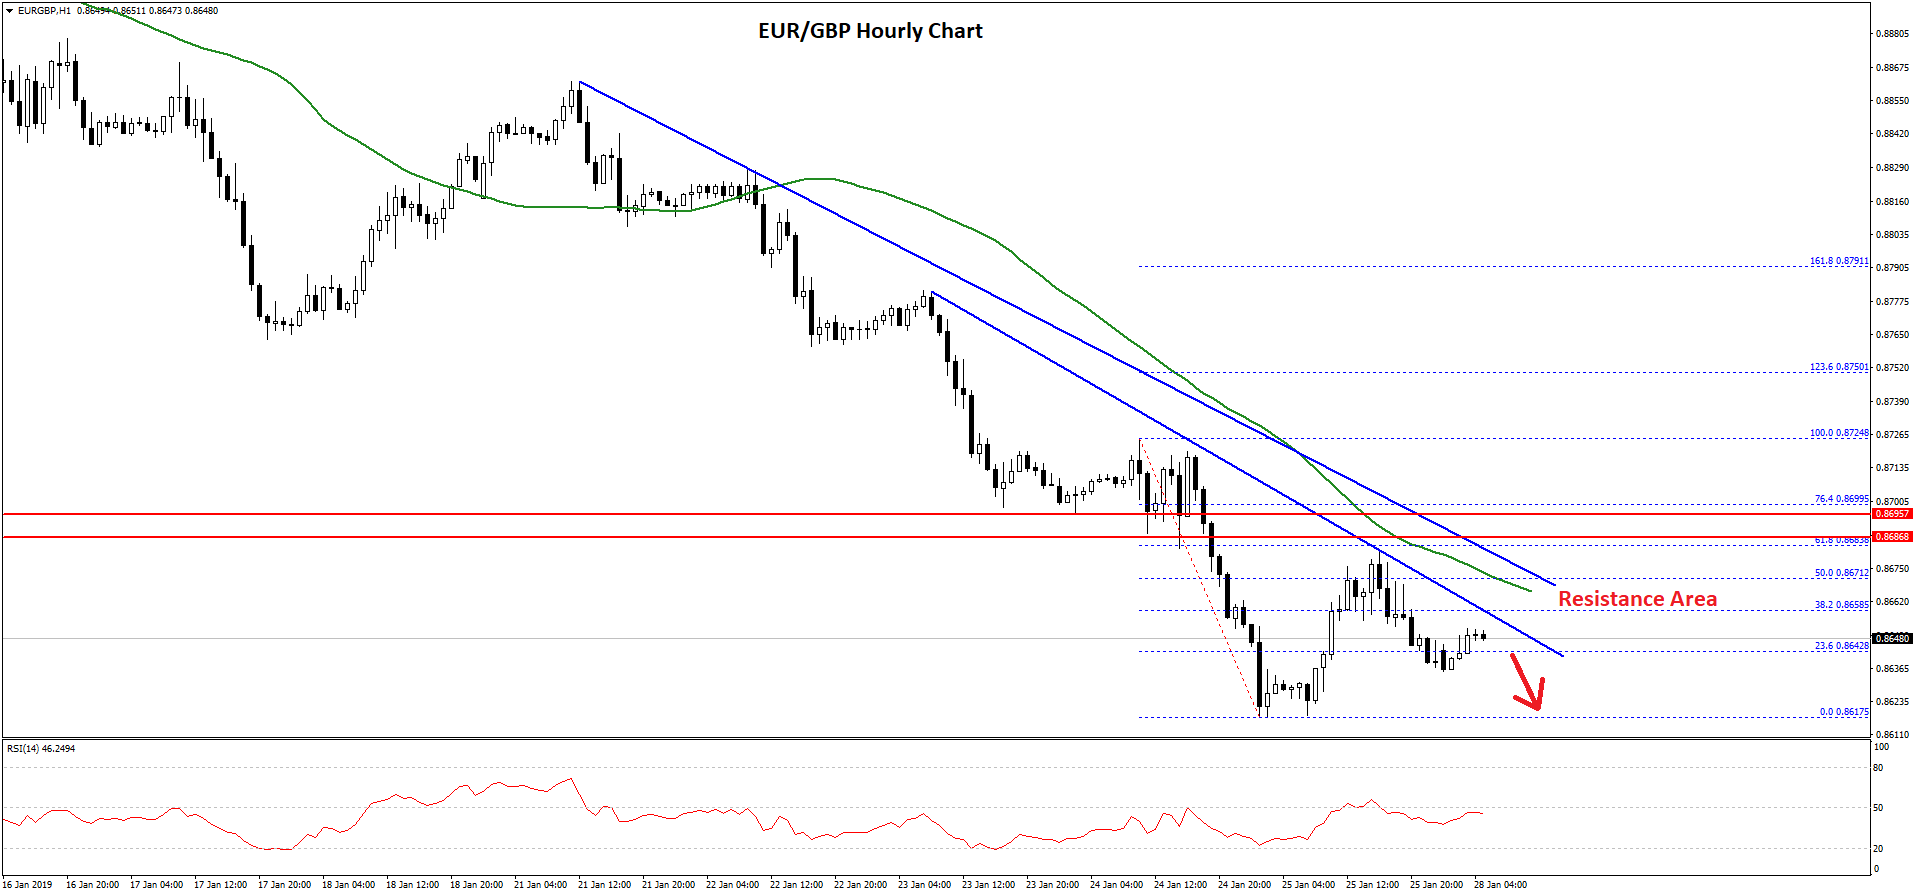
However, the upside move was protected by the 0.8680 level and the 50 hourly SMA. Moreover, there was no close above the 50% Fib retracement level of the recent decline from the 0.8724 high to 0.8617 low.
The pair is currently under pressure and it seems to be facing a lot hurdle near two bearish trend lines with resistance near the 0.8660 and 0.8670 levels on the hourly chart.
Therefore, as long as the EUR/GBP pair is trading below the 0.8670 level and the 50 hourly SMA, it remains at a risk of more losses. An initial support is at 0.8635, followed by the 0.8610 level.
Trade over 50 forex markets 24 hours a day with FXOpen. Take advantage of low commissions, deep liquidity, and spreads from 0.0 pips. Open your FXOpen account now or learn more about trading forex with FXOpen.
This article represents the opinion of the Companies operating under the FXOpen brand only. It is not to be construed as an offer, solicitation, or recommendation with respect to products and services provided by the Companies operating under the FXOpen brand, nor is it to be considered financial advice.
Latest from Forex Analysis
Latest articles

Is There the Best Time to Trade Stock CFDs?
If you ask experienced traders, many will say that they trade on certain days or at certain times of the day. Their choice is determined by the market dynamics, volatility, and liquidity. It’s crucial to understand when the best

UnitedHealth (UNH) Share Price Surges after Strong Report
UnitedHealth shares surged Tuesday, rising more than 5% after the health care giant delivered stronger-than-expected first-quarter 2024 results:
→ earnings per share: actual = USD 6.91, expected = USD 6.61, last quarter = USD 6.16;
→ gross income: actual = USD 94.4

USD/JPY Analysis: Prospect of a Breakout of the Level of 155 Yen per Dollar
The USD/JPY rate has consistently reached new highs since 1990, approaching the psychological level of 155 yen per US dollar. The Japanese currency has already fallen about 9% against the dollar this year.
This is supported by Jerome Powell,