


FXOpen
GBP/USD started an upward move from the 1.3000 support and it could recover above 1.3240. EUR/GBP declined recently and broke the key 0.8600 support area.
Important Takeaways for GBP/USD and EUR/GBP
- The British Pound is showing positive signs above the 1.3140 and 1.3160 levels.
- There was a break above a key bearish trend line with resistance at 1.3160 on the hourly chart of GBP/USD.
- EUR/GBP topped near the 0.8720 level and declined later sharply below the 0.8600 level.
- There was a break below a major bullish trend line at 0.8605 on the hourly chart.
GBP/USD Technical Analysis
The British Pound declined towards the 1.3000 support against the US Dollar, where buyers emerged. The GBP/USD pair traded as low as 1.3004 before the pair started a solid recovery.
The pair traded above the 1.3120 and 1.3140 resistance levels to move into a positive zone. Buyers gained control, resulting in a push above the 50% fib retracement level of the recent decline from the 1.3310 high to 1.3004 low.
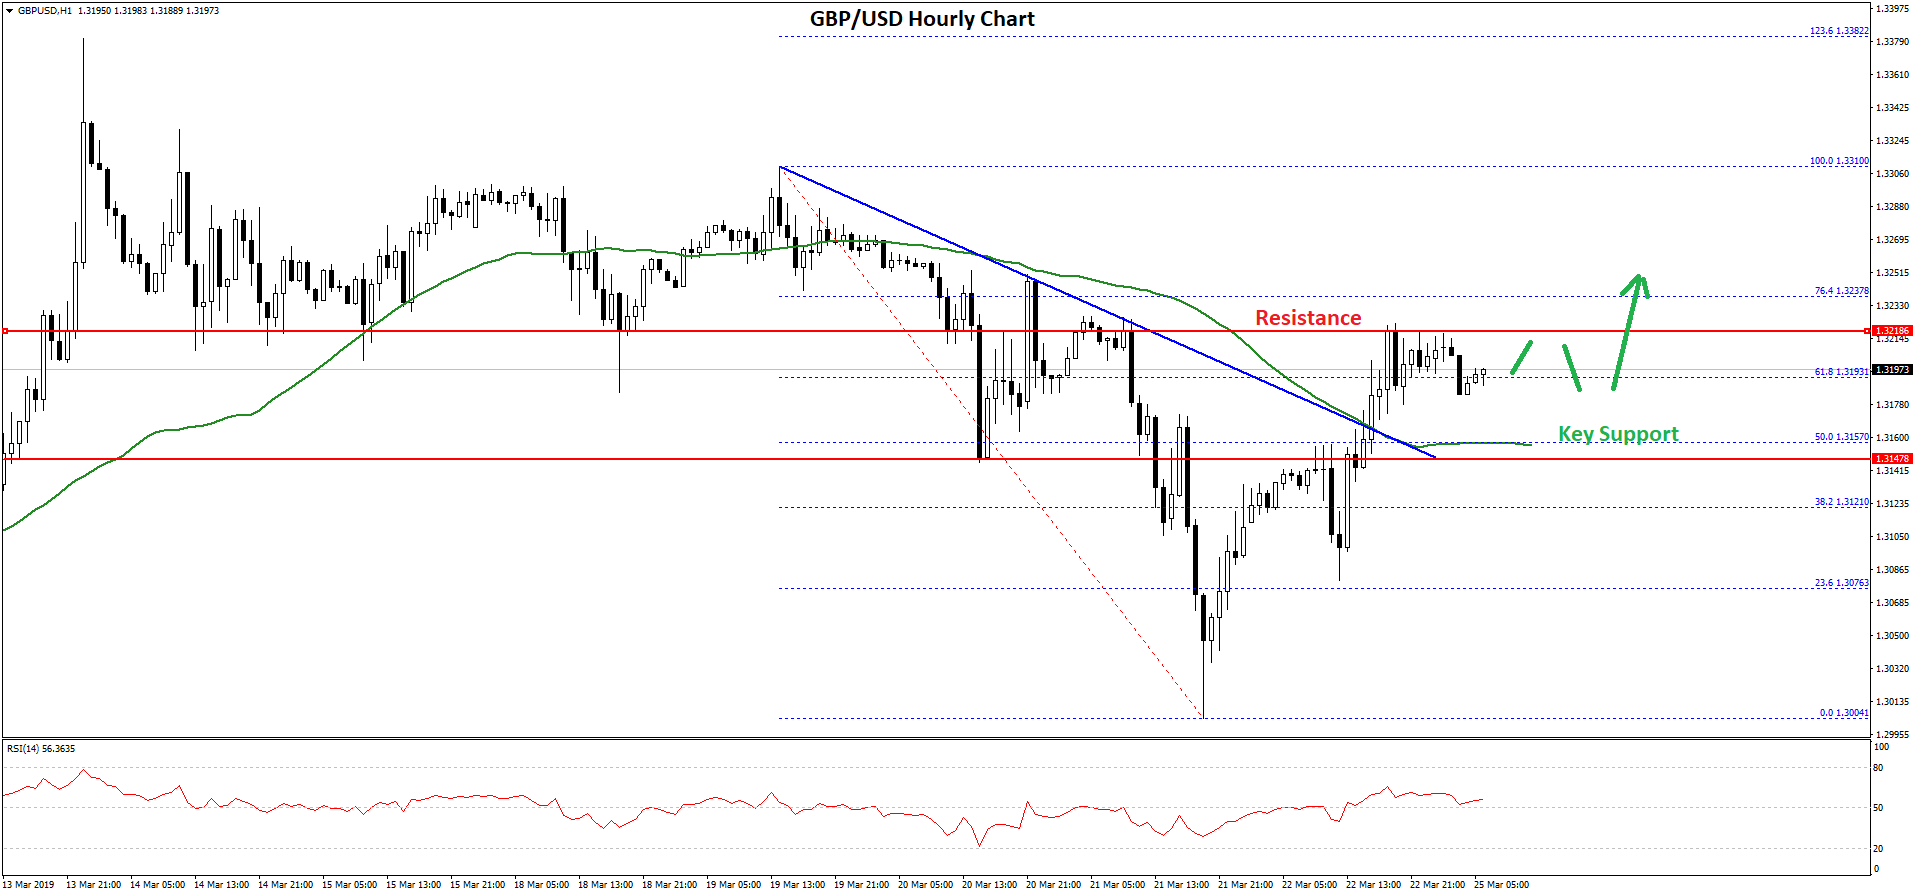
There was also a break above a key bearish trend line with resistance at 1.3160 on the hourly chart of GBP/USD. The pair is now trading nicely above 1.3150 on FXOpen and above the 50 hourly simple moving average.
The current price action is positive above the 61.8% fib retracement level of the recent decline from the 1.3310 high to 1.3004 low. An immediate resistance is near the 1.3220, where sellers are putting up a fight.
If there is an upside break above the 1.3220 level, the pair is likely to accelerate higher towards the 1.3250 and 1.3280 levels. On the downside, an initial support is near the 1.3150 level and the 50 hourly SMA.
Overall, dips remain supported in GBP/USD and there are high chances of more gains above the 1.3220 resistance in the near term.
EUR/GBP Technical Analysis
The Euro rallied this past week and traded above the 0.8640 and 0.8700 resistance levels against the British Pound. The EUR/GBP pair climbed towards the 0.8720 level, where sellers emerged.
Later, there was a sharp downside correction and the pair traded below the 0.8700 and 0.8650 support levels. There was also a break below a major bullish trend line at 0.8605 on the hourly chart, opening the doors for more losses below 0.8600.
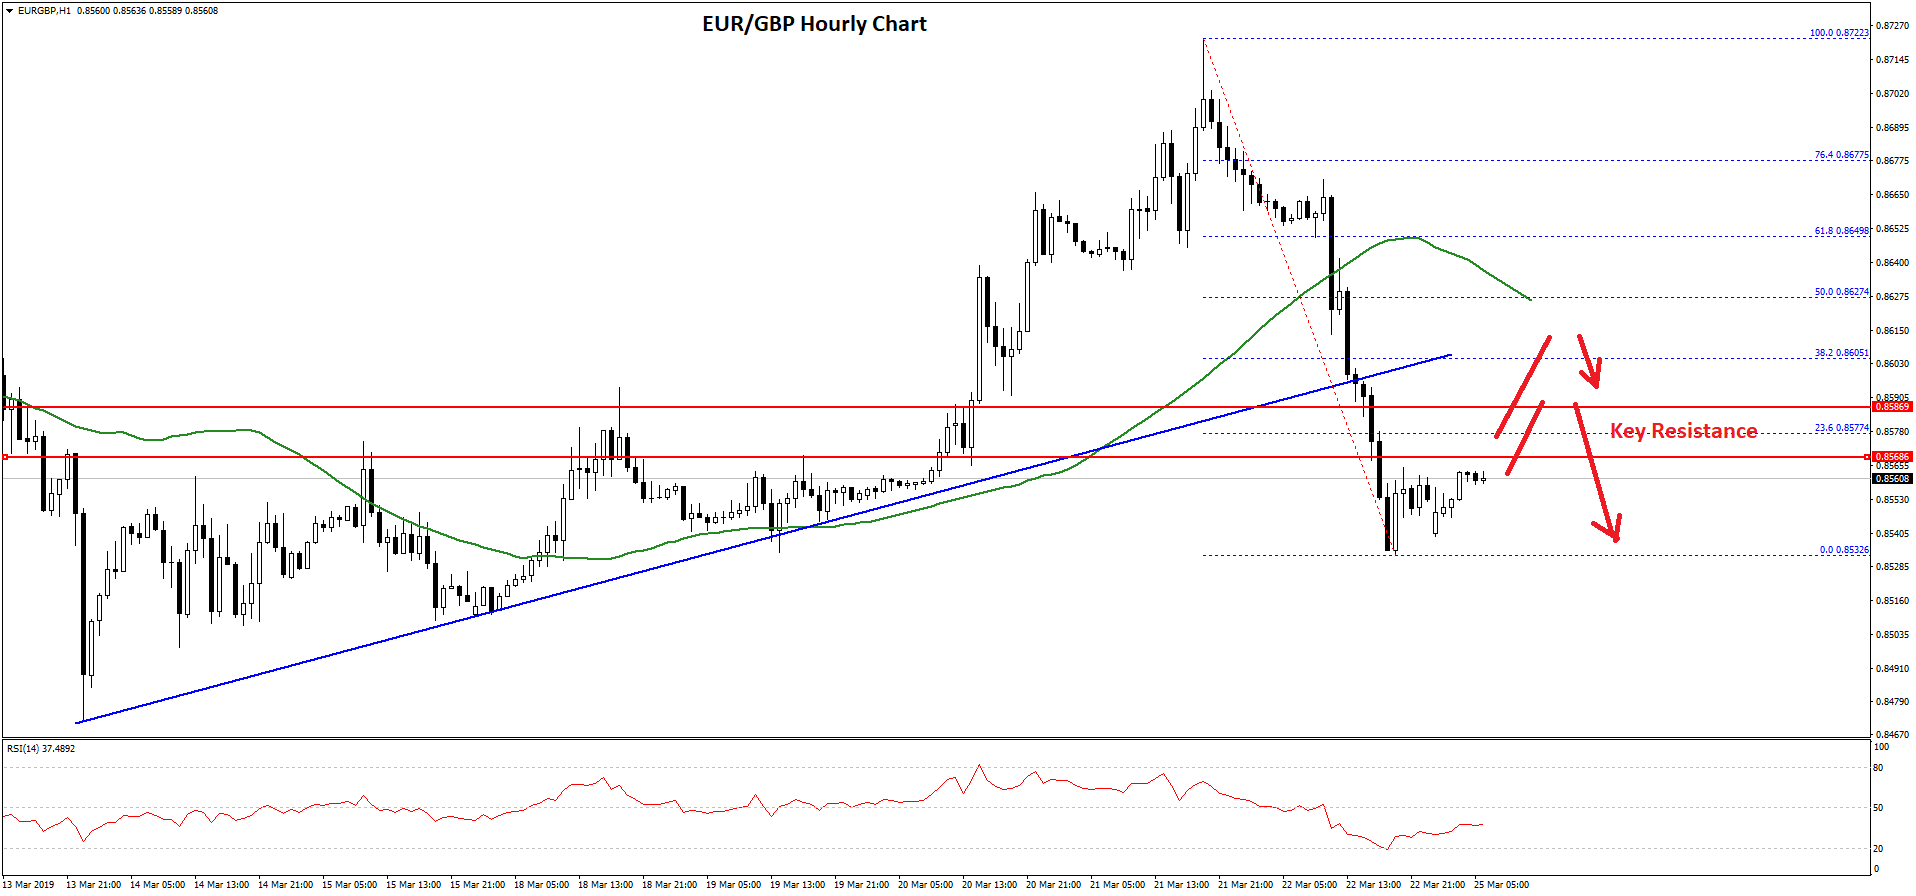
The pair even broke the 0.8580 support and settled well below the 50 hourly simple moving average. It traded as low as 0.8532 and it is currently correcting higher. An initial resistance is near the 0.8575 and the 23.6% Fib retracement level of the recent decline from the 0.8722 high to 0.8532 low.
However, a proper break above the 0.8600 resistance is need for buyers to gain momentum. The next key resistance above 0.8600 is near 0.8628 and the 50% Fib retracement level of the recent decline from the 0.8722 high to 0.8532 low.
The 50 hourly SMA is also positioned near the 0.8625 level. Therefore, upsides are likely to remain capped by the 0.8600 or 0.8625 levels.
On the downside, an initial support is near the 0.8540 level. If buyers fail to push EUR/GBP above the 0.8600 level, there are chances of a downside break towards the 0.8500 support level.
Trade over 50 forex markets 24 hours a day with FXOpen. Take advantage of low commissions, deep liquidity, and spreads from 0.0 pips. Open your FXOpen account now or learn more about trading forex with FXOpen.
This article represents the opinion of the Companies operating under the FXOpen brand only. It is not to be construed as an offer, solicitation, or recommendation with respect to products and services provided by the Companies operating under the FXOpen brand, nor is it to be considered financial advice.
Latest from Forex Analysis
Latest articles

Since the Start of the Week, Brent Oil Price Has Dropped over 4%
At the beginning of the week, March 15, we wrote that the price of Brent oil could form a correction from the resistance level of USD 91 per barrel. Since then, the price has decreased by more than 4% due

Fair Value Gaps vs Liquidity Voids in Trading
Understanding fair value gaps and liquidity voids is essential for traders seeking to navigate the complexities of the financial markets. These concepts, deeply rooted in the Smart Money Concept (SMC), provide valuable insights into the dynamics of supply and demand,

UK100 Share Index Rises as UK Inflation Slows
Yesterday, the UK Office for National Statistics (ONS) reported that the CPI stood at 3.2% in March. According to ForexFactory, analysts expected 3.1%, and a month ago the index was 3.4%.
Grant Fitzner, chief economist at the