


FXOpen
GBP/USD climbed higher recently and settled above the 1.3100 level. EUR/GBP is currently correcting higher, but it is likely to face selling interest near the 0.8550 level.
Important Takeaways for GBP/USD and EUR/GBP
- The British Pound gained strength recently and climbed above 1.3040 and 1.3100 resistances.
- There was a break above a declining channel with resistance at 1.3040 on the hourly chart of GBP/USD.
- EUR/GBP declined heavily and broke the 0.8580 and 0.8500 support levels.
- There was a break below a declining channel with support near 0.8540 on the hourly chart.
GBP/USD Technical Analysis
The British Pound formed a strong support near the 1.2880 and 1.2900 levels against the US Dollar. The GBP/USD pair started a fresh increase above the 1.3000 resistance to move into a positive zone.
The pair gained momentum above the 1.3020 level and the 50 hourly simple moving average. During the upward move, there was a break above a declining channel with resistance at 1.3040 on the hourly chart of GBP/USD.
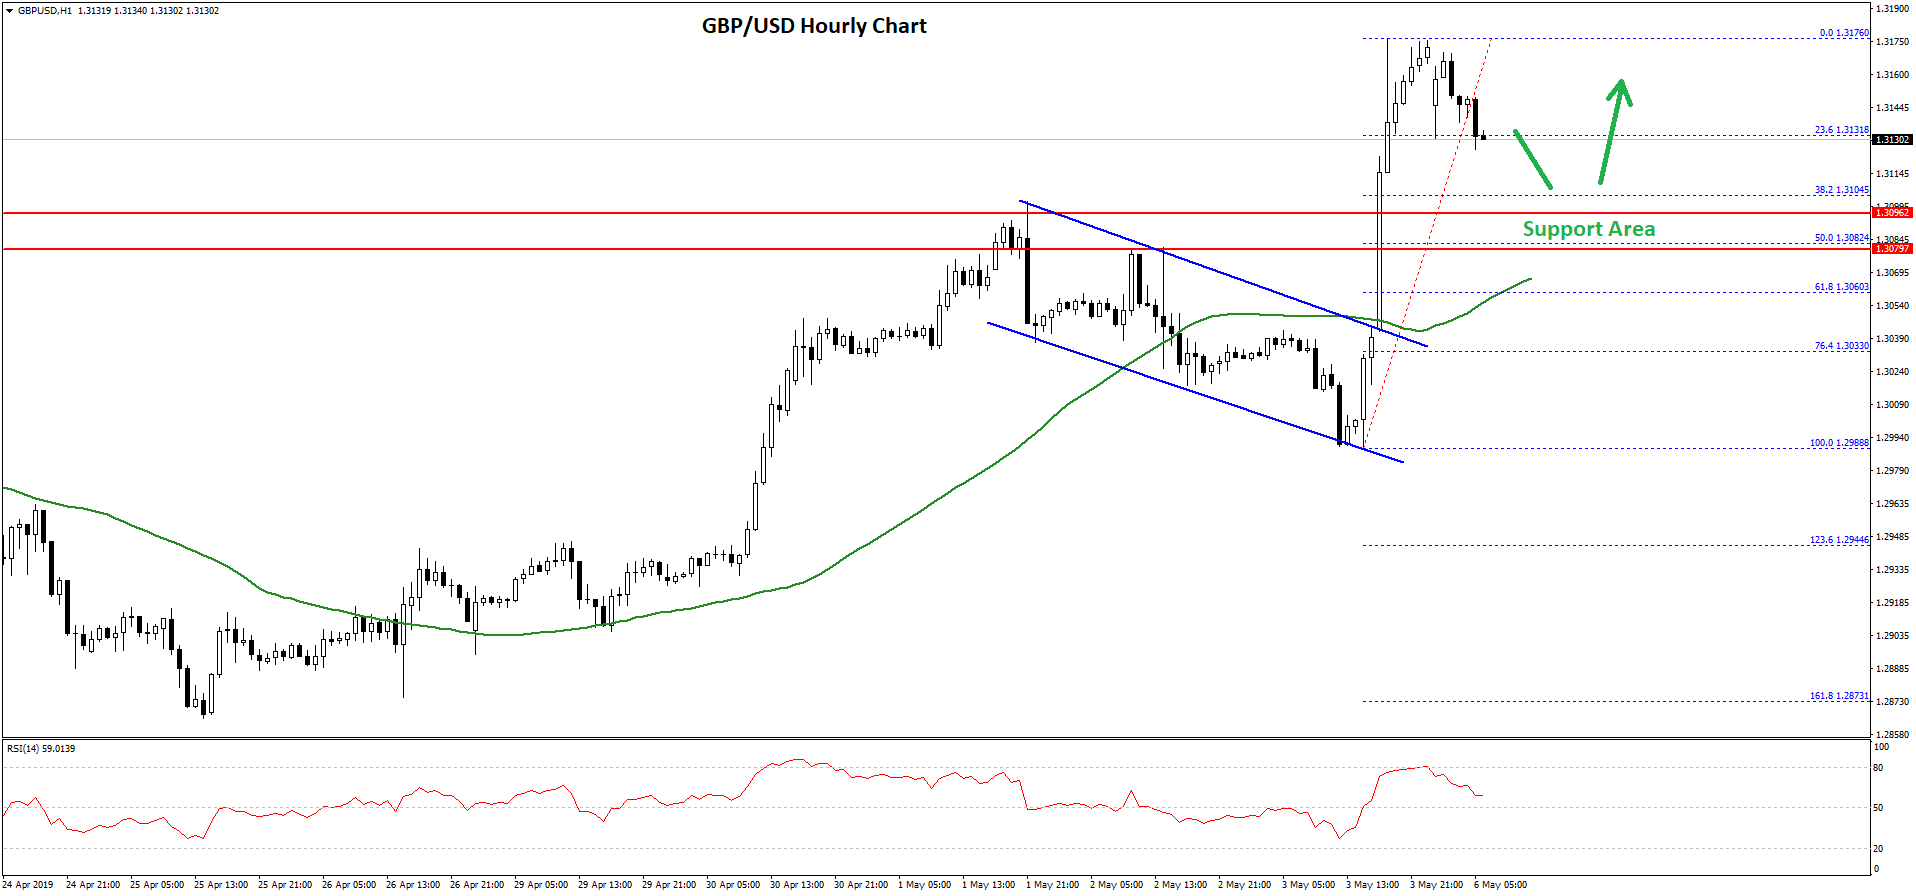
The pair even climbed above 1.3150 and traded as high as 1.3175 on FXOpen. Recently, it started a downside correction below the 1.3150 level and the 23.6% Fib retracement level of the recent wave from the 1.2988 low to 1.3176 high.
On the downside, there are many supports near the 1.3100 and 1.3080 levels. The 50% Fib retracement level of the recent wave from the 1.2988 low to 1.3176 high is also near the 1.3080 level to act as a strong support.
Finally, the 50 hourly SMA is near the 1.3070 level to provide support. Below 1.3070, the price could extend losses towards the 1.3020 level.
On the upside, an initial resistance is near the 1.3150 level, above which the GBP/USD pair is likely to test the 1.3180 and 1.3200 resistance levels in the near term.
EUR/GBP Technical Analysis
The Euro declined heavily from well above the 0.8620 level against the British Pound. The EUR/GBP pair broke the 0.8580 and 0.8550 support levels to enter a downtrend.
The decline was such that the pair even broke the 0.8520 support level and settled below the 50 hourly simple moving average. During the decline, there was a break below a declining channel with support near 0.8540 on the hourly chart.
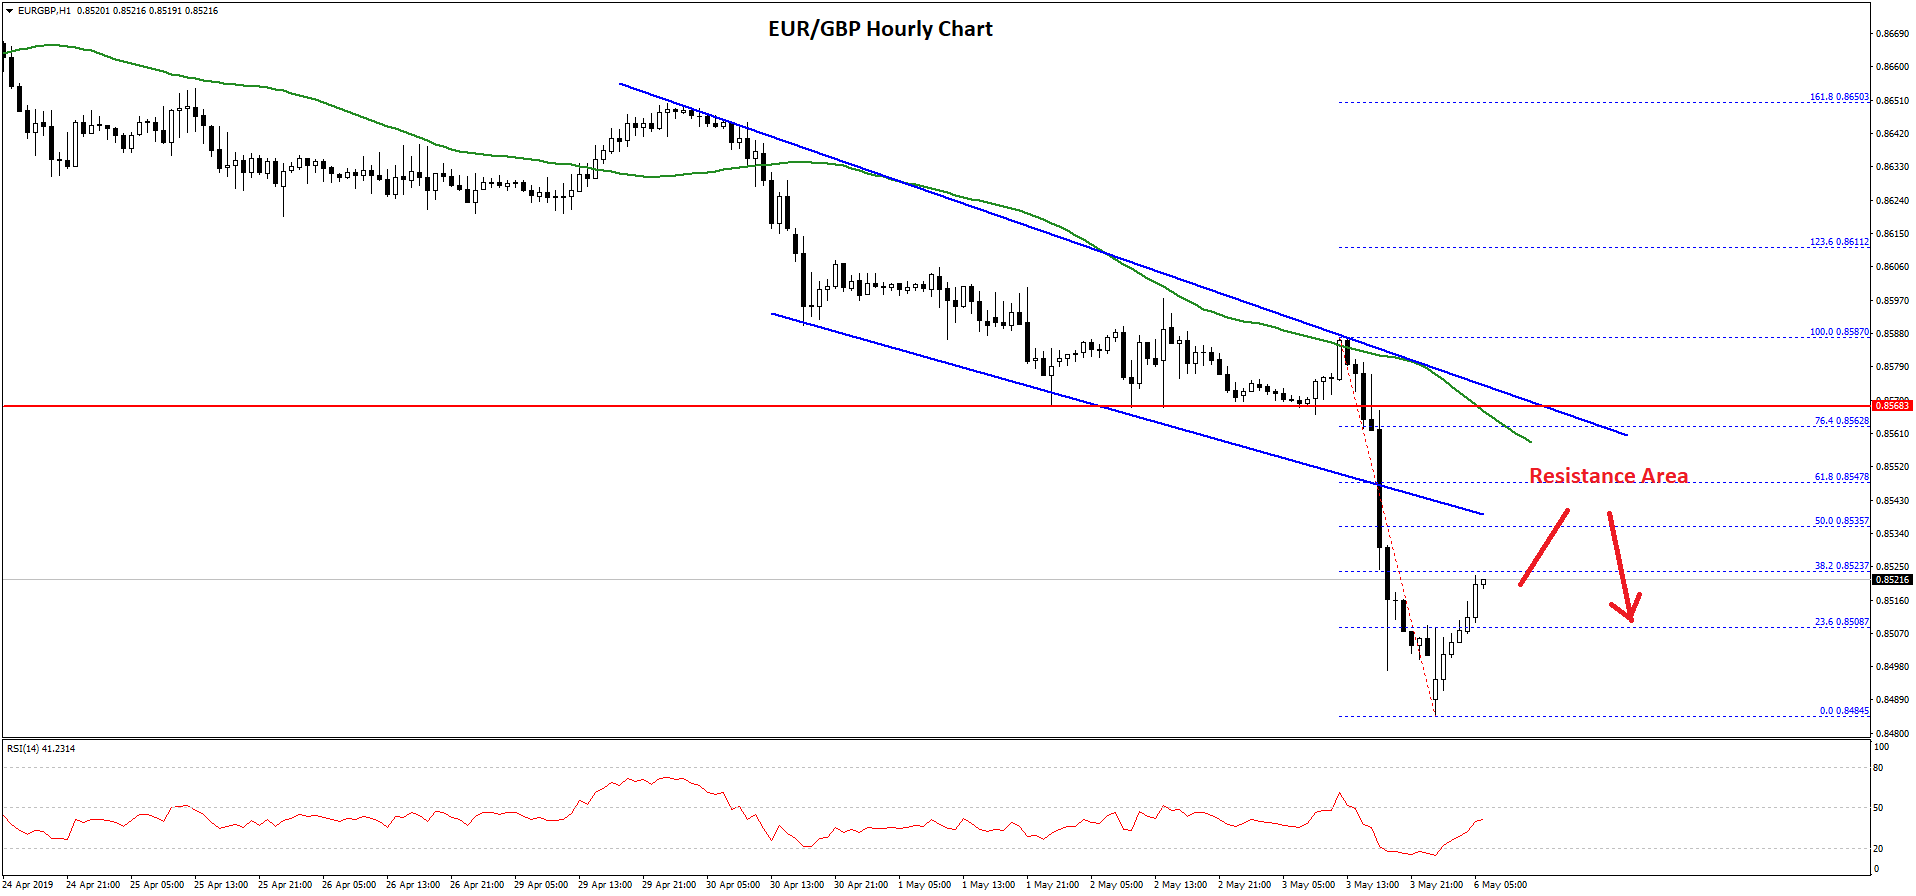
Finally, the pair spiked below the 0.8500 level and the pair traded as low as 0.8484. Recently, it started an upside correction above the 0.8500 level and the 38.2% fib retracement level of the last drop from the 0.8587 high to 0.8484 low.
On the upside, there is a strong resistance waiting near the 0.8540 and 0.8550 levels. The 50% fib retracement level of the last drop from the 0.8587 high to 0.8484 low is also near 0.8535 to act as a solid hurdle for the bulls.
If the pair fails to move above the 0.8540 or 0.8550 resistance, there could be a fresh decline below the 0.8510 and 0.8500 support levels.
The main support is near the 0.8500 level, below which there is a risk of a break towards the 0.8460 level. On the upside, a successful close above 0.8550 and the 50 hourly SMA is needed for a fresh increase in EUR/GBP in the near term.
Trade over 50 forex markets 24 hours a day with FXOpen. Take advantage of low commissions, deep liquidity, and spreads from 0.0 pips. Open your FXOpen account now or learn more about trading forex with FXOpen.
This article represents the opinion of the Companies operating under the FXOpen brand only. It is not to be construed as an offer, solicitation, or recommendation with respect to products and services provided by the Companies operating under the FXOpen brand, nor is it to be considered financial advice.
Latest from Forex Analysis
Latest articles

Look East! An Exciting Insight into FXOpen's New Hong Kong-listed Stock CFDs
Hong Kong has built up a gilt-edged reputation as one of the world's most reputable financial market centres. The city of Hong Kong enjoyed a unique position for many years. It is situated in the Asia Pacific region, very close

AUD/USD Rises Sharply on Inflation News
The Consumer Price Index for Australia was released this morning. According to ForexFactory:
→ CPI in quarterly terms: actual = 1.0%, expected = 0.8%, previous value = 0.6%;
→ CPI in annual terms: actual = 3.5%, expected = 3.4%, previous value = 3.

TSLA Share Price Up About 13% Despite Disappointing Report
Yesterday, TSLA trading closed at USD 144.68 per share, after which Tesla reported its results for the 1st quarter:
→ earnings per share: actual = USD 0.45, forecast = USD 0.49;
→ gross income: actual = USD 21.45 billion, forecast = USD