


FXOpen
GBP/USD started a decent upward move above the 1.2600 resistance. EUR/GBP is currently correcting lower towards the 0.8830 support area.
Important Takeaways for GBP/USD and EUR/GBP
- The British Pound declined recently and tested the 1.2560 support area.
- There was a break above a major bearish trend line with resistance at 1.2610 on the hourly chart of GBP/USD.
- EUR/GBP traded towards the 0.8880 resistance level before starting a downside correction.
- There is a key bullish trend line forming with support near 0.8830 on the hourly chart.
GBP/USD Technical Analysis
The British Pound remained in a strong downtrend and traded below the 1.2650 support area against the US Dollar. The GBP/USD pair broke the key 1.2600 support area to enter a bearish zone.
The pair even broke the 1.2580 support and settled below the 50 hourly simple moving average. It traded as low as 1.2560 before starting an upside correction.
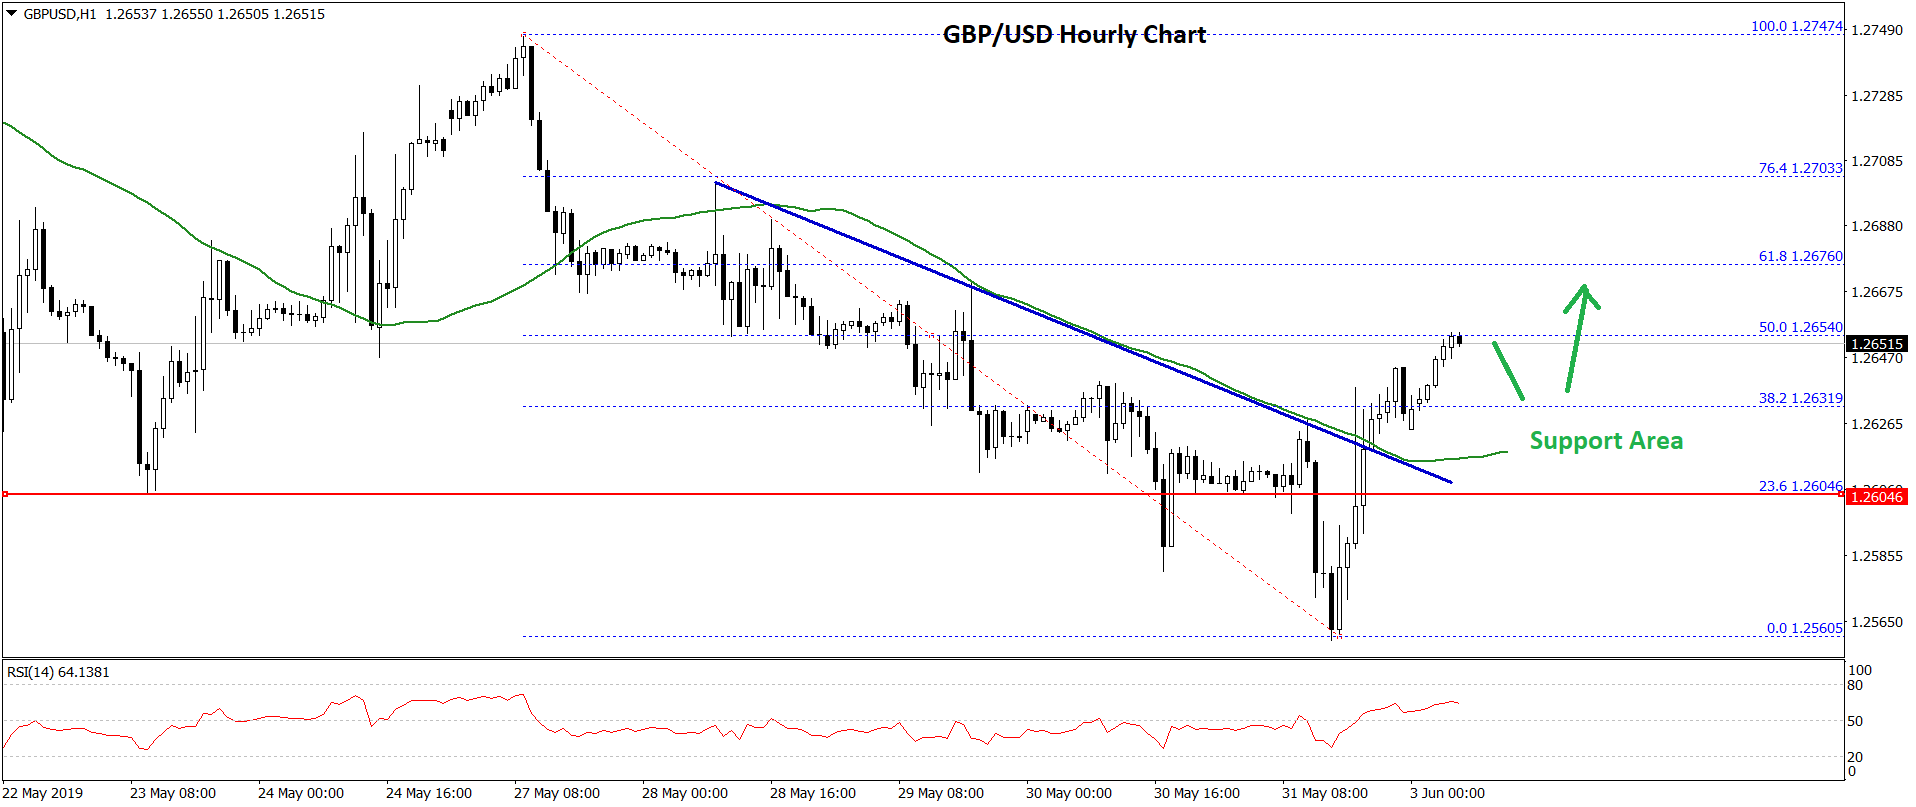
The bulls pushed the price above the 1.2600 resistance and the 50 hourly simple moving average. There was a break above the 23.6% Fib retracement level of the latest drop from the 1.2747 high to 1.2560 low.
Moreover, there was a break above a major bearish trend line with resistance at 1.2610 on the hourly chart of GBP/USD. The pair is currently testing the 50% Fib retracement level of the latest drop from the 1.2747 high to 1.2560 low.
On the upside, an initial resistance is near the 1.2670 level. If there are more gains, the pair could continue higher towards the 1.2700 level.
Conversely, if there is a downside correction, the pair could decline towards the 1.2630 support area. If the pair fails to stay above the 1.2620 support, there is a risk of a downside break in the near term.
The next key support is near the 1.2600 level, below which GBP/USD could revisit the 1.2560 support area. Overall, the pair remains supported on dips and it could move towards 1.2700.
EUR/GBP Technical Analysis
The Euro started a strong upward move from the 0.8800 support area against the British Pound. The EUR/GBP pair traded above the 0.8840 resistance level to move into a positive zone.
The upward move was strong since the pair traded above the 0.8850 and 0.8860 levels. There was also a close above the 50 hourly simple moving average. The pair traded close to the 0.8880 level before starting a downside correction.
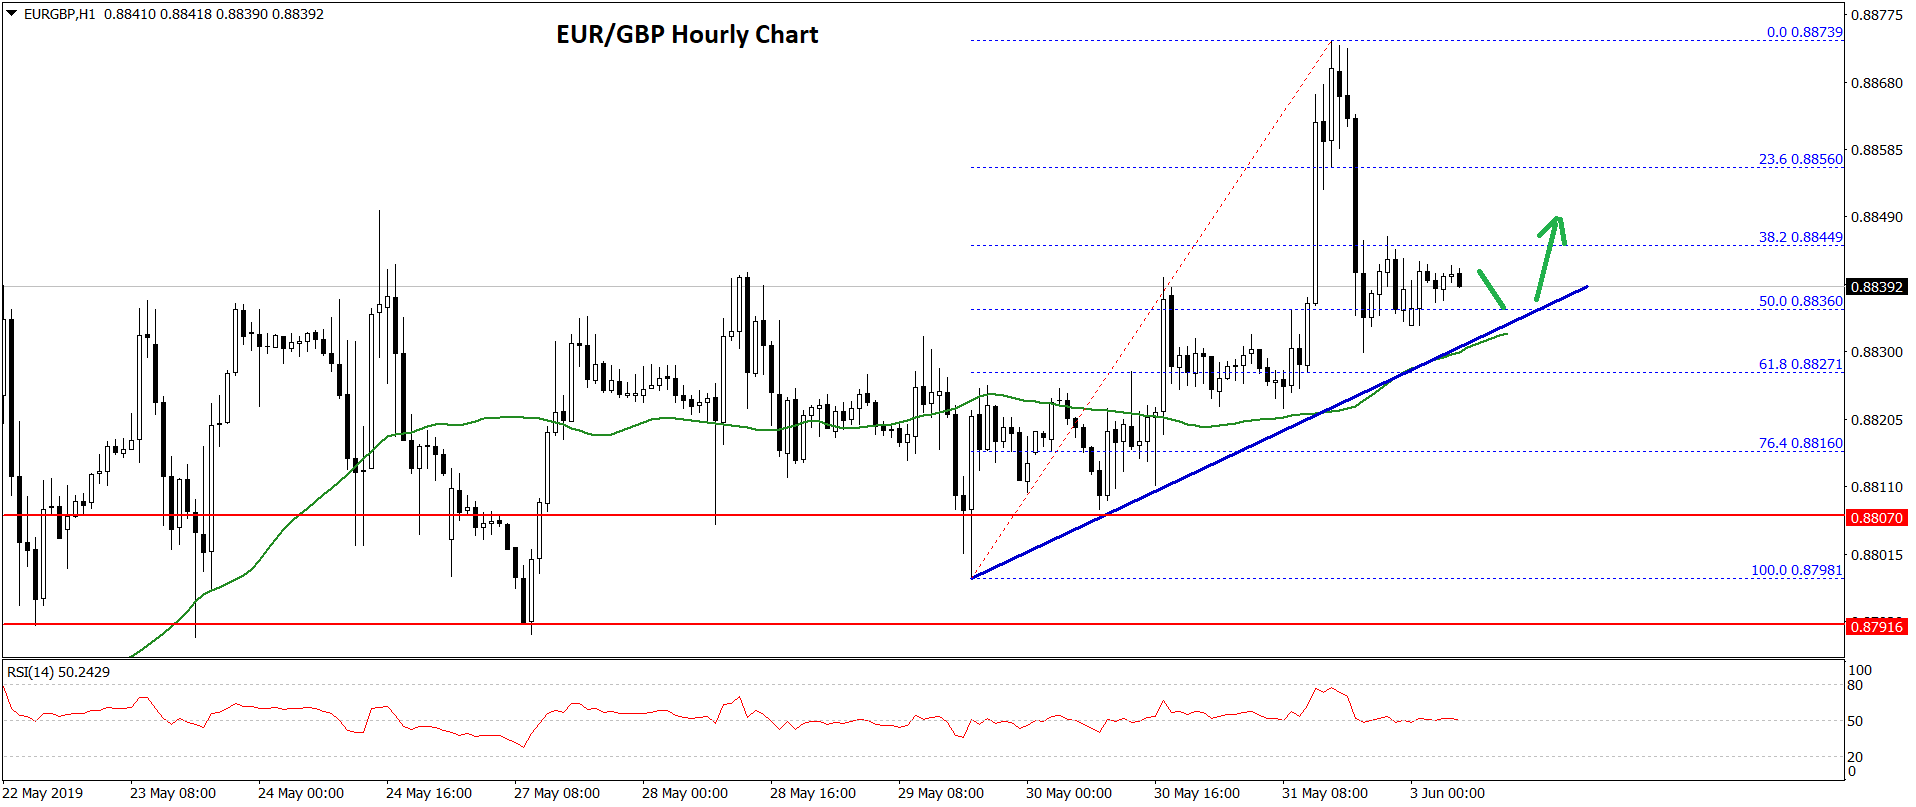
It broke the 23.6% fib retracement level of the recent wave from the 0.8798 low to 0.8873 high. On the downside, there are many supports near the 0.8830 level and the 50 hourly SMA.
There is a key bullish trend line forming with support near 0.8830 on the hourly chart. The 50% fib retracement level of the recent wave from the 0.8798 low to 0.8873 high is also near the 0.8835 level.
Therefore, the pair is likely to find a strong buying interest near the 0.8830 level. If there is a downside break below 0.8830, the pair could move back in a negative zone.
On the upside, an initial resistance is near the 0.8850 level. If there is an upside break above 0.8850 level, the pair could start a fresh increase towards the 0.8880 level.
Trade over 50 forex markets 24 hours a day with FXOpen. Take advantage of low commissions, deep liquidity, and spreads from 0.0 pips. Open your FXOpen account now or learn more about trading forex with FXOpen.
This article represents the opinion of the Companies operating under the FXOpen brand only. It is not to be construed as an offer, solicitation, or recommendation with respect to products and services provided by the Companies operating under the FXOpen brand, nor is it to be considered financial advice.
Latest from Forex Analysis
Latest articles

Google Share Price Rose Post-market to a New All-time Record
Yesterday, after the close of the main trading session, a report on activities for the 1st quarter of Alphabet Inc. (Google's parent company) was published. The report was strong, exceeding investors' expectations.
→ Quarterly EPS = USD 1.89 (expected = USD 1.

S&P 500 Rebounds after Negative GDP News
Data released yesterday showed US GDP growth slowed to 1.6% in the first quarter of the year. According to ForexFactory: forecast = 2.2%, past value = 2.4%.
Reaction to the news sent the S&P 500 mini stock

GBP/USD And USD/CAD Daily Chart Outlook
GBP/USD is attempting a recovery wave from 1.2300. USD/CAD is consolidating and might aim for a move above the 1.3760 resistance zone.
Important Takeaways for GBP/USD and USD/CAD Analysis Today
· The British Pound started