


FXOpen

GBP/USD started a solid upward move from the 1.2150 support area and climbed above 1.2500. EUR/GBP is currently declining and it might continue to struggle below 0.8900.
Important Takeaways for GBP/USD and EUR/GBP
- The British Pound climbed higher sharply above the 1.2400 and 1.2440 resistance levels.
- There was a break above a major bearish trend line with resistance near 1.2350 on the hourly chart of GBP/USD.
- EUR/GBP declined heavily and broke the 0.9000 and 0.8950 support levels.
- There is a connecting bearish trend line forming with resistance near 0.8960 on the hourly chart.
GBP/USD Technical Analysis
The British Pound started a strong rise after it broke the 1.2300 resistance area against the US Dollar. The GBP/USD pair climbed above the 1.2400 resistance level to continue higher and post a new monthly high.
The pair even settled above the 1.2400 level and the 50 hourly simple moving average. Moreover, there was a break above a major bearish trend line with resistance near 1.2350 on the hourly chart of GBP/USD.
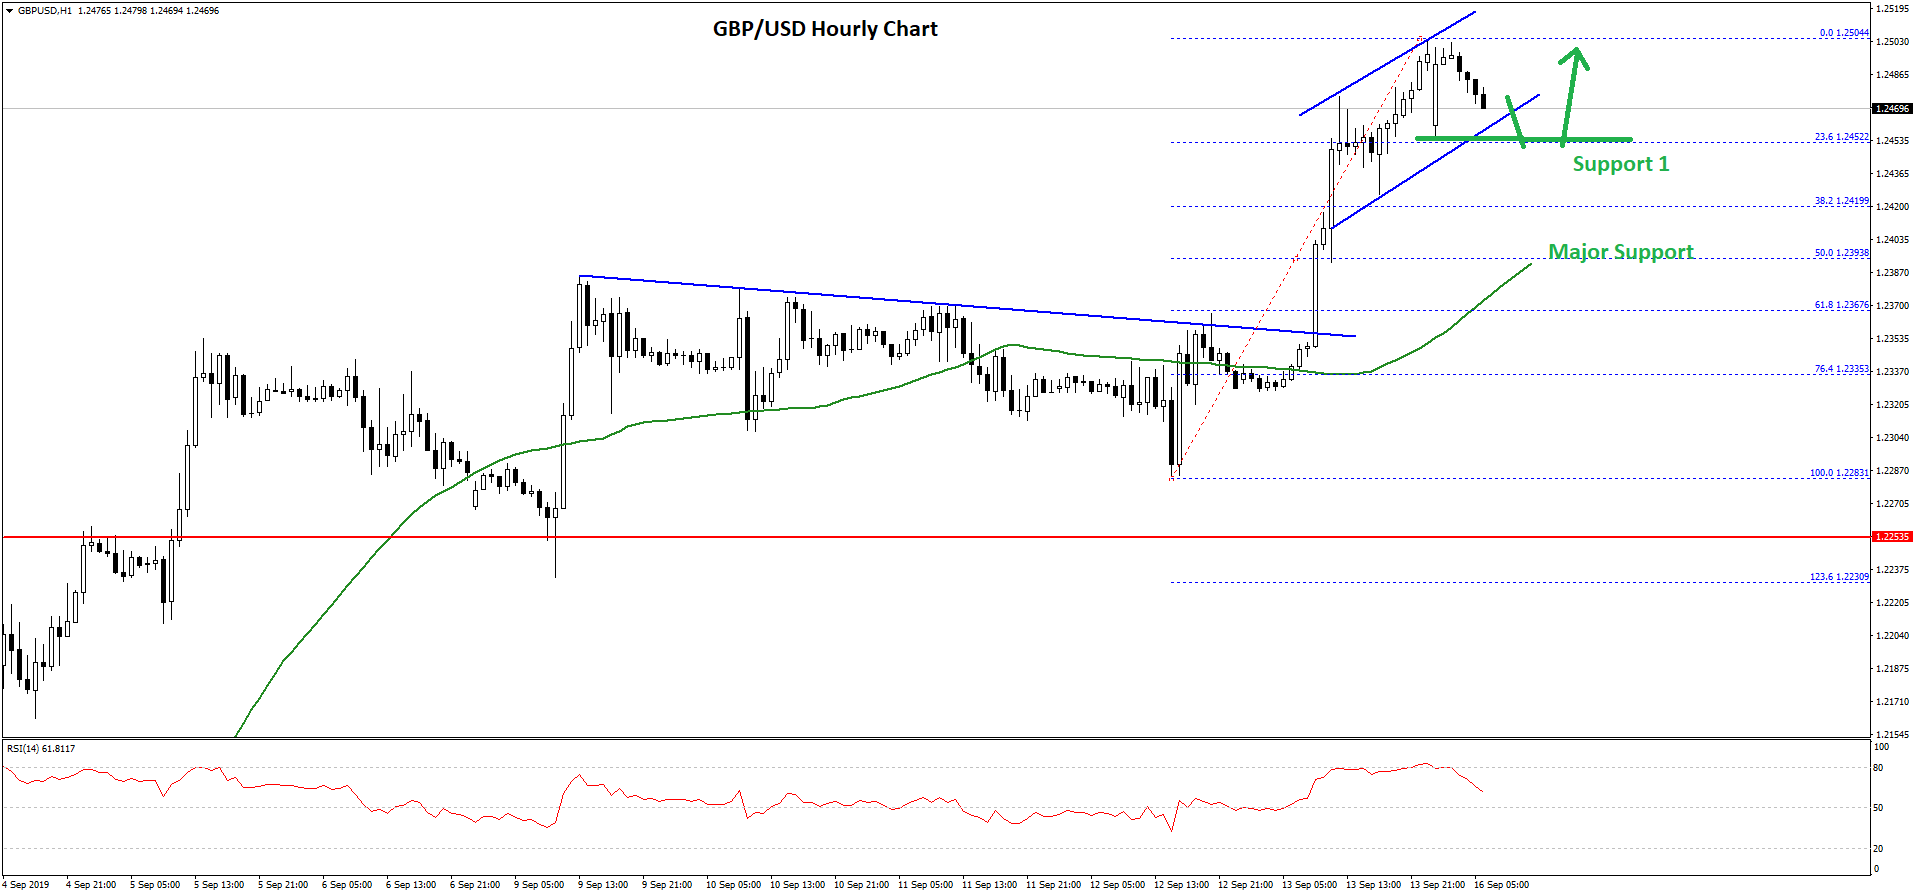
Finally, the pair broke the 1.2450 resistance and spiked above the 1.2500 level. A swing high was formed near 1.2504 and the pair is currently correcting lower.
An immediate support is near the 1.2450 level, plus the 23.6% Fib retracement level of the recent leg from the 1.2283 low to 1.2504 high. If there is an extended downside correction, the pair could test the main 1.2400 support level.
The 50% Fib retracement level of the recent leg from the 1.2283 low to 1.2504 high is also near the 1.2395 level to act as a support. Moreover, the 50 hourly SMA is also near the 1.2400 level to provide support.
Therefore, dips towards the 1.2400 level is likely to find buyers in the coming sessions. On the upside, an immediate resistance is near the 1.2500 level, above which the GBP/USD pair could climb towards the 1.2540 level.
EUR/GBP Technical Analysis
The Euro started a downside correction from well above the 0.9050 level against the British Pound. The EUR/GBP pair broke the key 0.9000 support level to enter to start the downside correction.
During the decline, the pair broke the 0.8940 support and the 50 hourly simple moving average. More importantly, the pair broke the 0.8900 support level and traded to a new monthly low near the 0.8851 level.
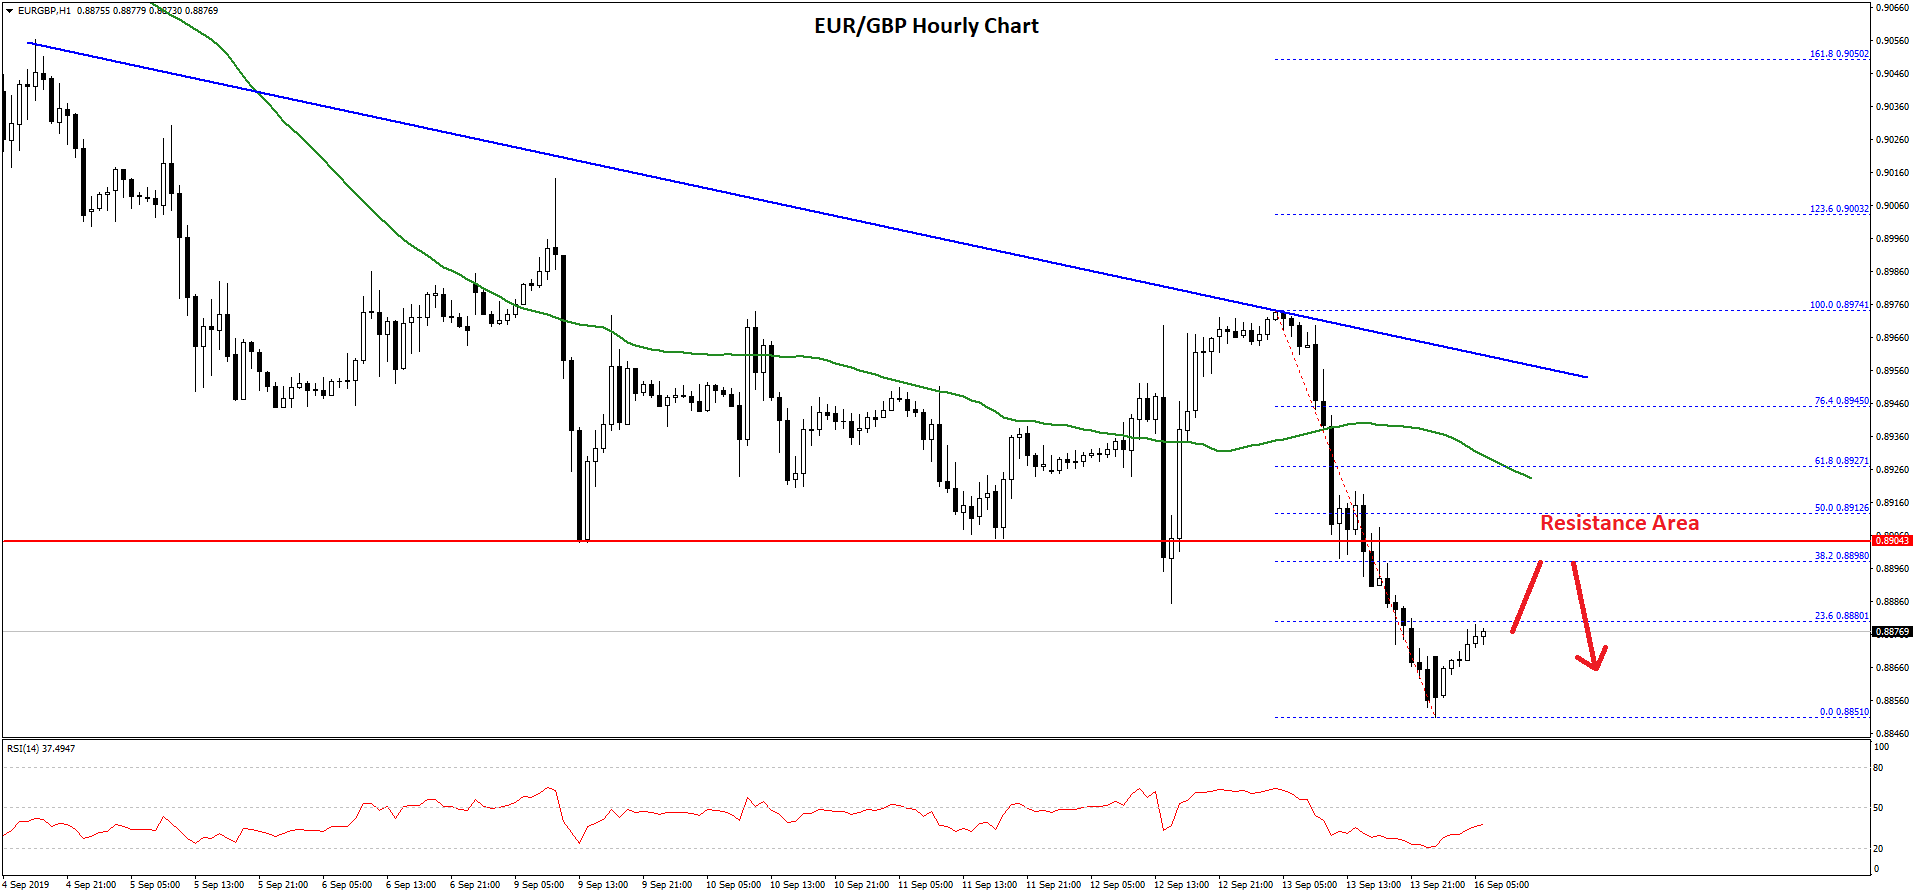
The pair is currently correcting higher and is trading near the 23.6% Fib retracement level of the recent decline from the 0.8974 high to 0.8851 low. However, there is a strong resistance forming on the upside near the 0.8900 and 0.8910 levels.
The 50% Fib retracement level of the recent decline from the 0.8974 high to 0.8851 low is also near the 0.8910 level to stop the recovery in the near term.
Moreover, there is a connecting bearish trend line forming with resistance near 0.8960 on the hourly chart. Therefore, upsides are likely to face hurdles near the 0.8900, 0.8905 and 0.8910 levels. Any further gains could push the pair towards the 0.8950 and 0.8960 resistance levels.
On the downside, an immediate support is near the 0.8850 level, below which EUR/GBP could extend its decline towards the 0.8820 and 0.8800 support levels in the coming sessions.
Trade over 50 forex markets 24 hours a day with FXOpen. Take advantage of low commissions, deep liquidity, and spreads from 0.0 pips. Open your FXOpen account now or learn more about trading forex with FXOpen.
This article represents the opinion of the Companies operating under the FXOpen brand only. It is not to be construed as an offer, solicitation, or recommendation with respect to products and services provided by the Companies operating under the FXOpen brand, nor is it to be considered financial advice.
Latest from Forex Analysis
Latest articles

Since the Start of the Week, Brent Oil Price Has Dropped over 4%
At the beginning of the week, March 15, we wrote that the price of Brent oil could form a correction from the resistance level of USD 91 per barrel. Since then, the price has decreased by more than 4% due

Fair Value Gaps vs Liquidity Voids in Trading
Understanding fair value gaps and liquidity voids is essential for traders seeking to navigate the complexities of the financial markets. These concepts, deeply rooted in the Smart Money Concept (SMC), provide valuable insights into the dynamics of supply and demand,

UK100 Share Index Rises as UK Inflation Slows
Yesterday, the UK Office for National Statistics (ONS) reported that the CPI stood at 3.2% in March. According to ForexFactory, analysts expected 3.1%, and a month ago the index was 3.4%.
Grant Fitzner, chief economist at the