


FXOpen
EUR/USD declined sharply and broke a key support at 1.1700. On the other hand, USD/JPY accelerated gains and is currently placed nicely above 112.60.
Important Takeaways for EUR/USD and USD/JPY
- The Euro failed to move above the 1.1745 resistance and declined sharply.
- There was a break below a key bullish trend line with support at 1.1730 on the hourly chart of EUR/USD.
- USD/JPY remains in an uptrend above the 112.60 support level.
- There is a crucial bullish trend line in place with support at 112.65 on the hourly chart.
EUR/USD Technical Analysis
The Euro recovered nicely this past week and moved above the 1.1700 resistance against the US Dollar. However, the EUR/USD pair failed to move above the 1.1740-45 resistance area and declined once again.
The pair started a major downward move and broke the 1.1720 support area. More importantly, there was a break below a key bullish trend line with support at 1.1730 on the hourly chart.
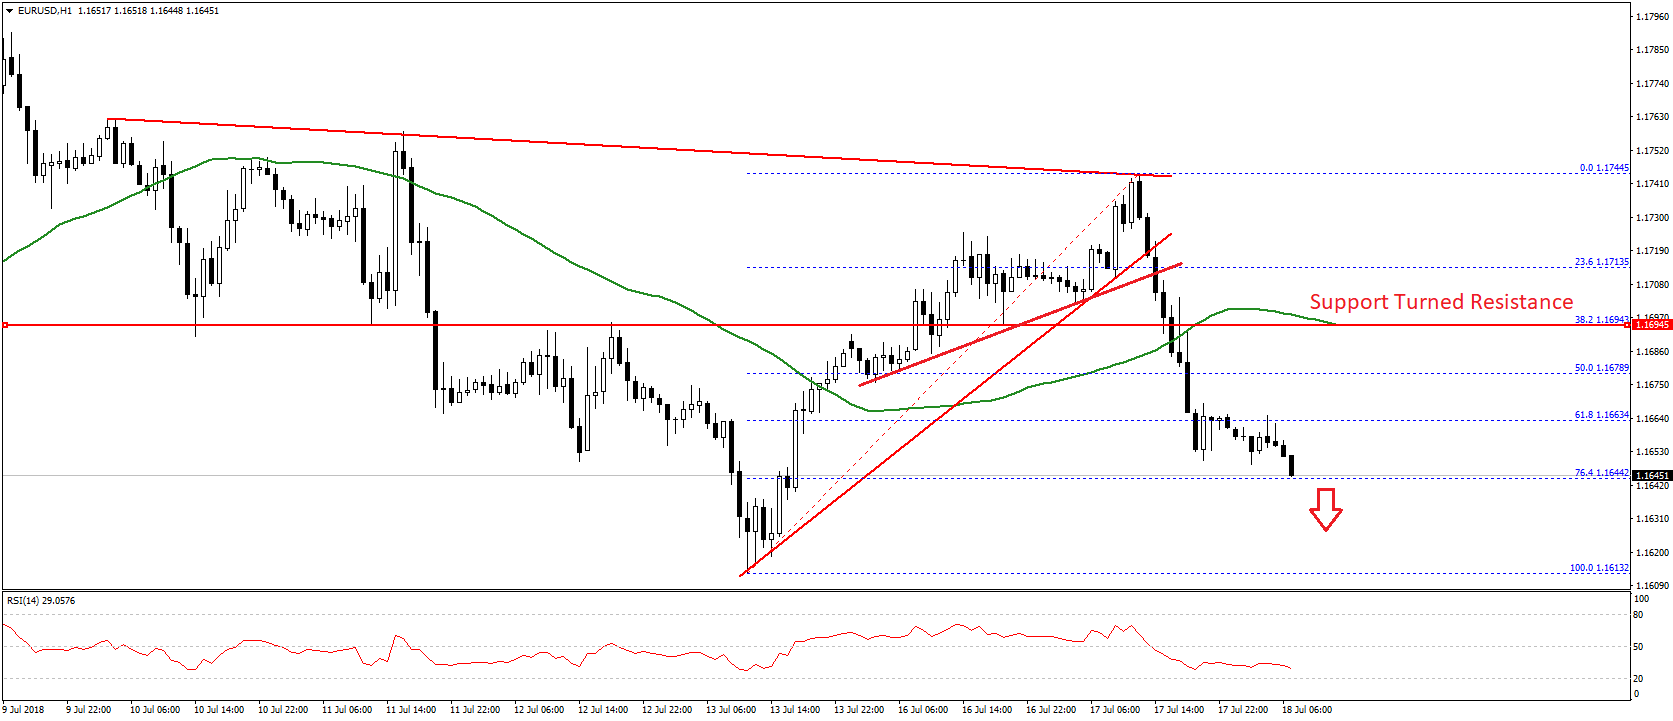
Later, there was a break below the 50% Fib retracement level of the last wave from the 1.1613 low to 1.1744 high. The pair is now placed well below the 1.1700 level and the 50 hourly simple moving average.
It is currently testing the 76.4% Fib retracement level of the last wave from the 1.1613 low to 1.1744 high near 1.1644. Should there be a downside break below 1.1640, the pair is likely to decline further towards the last swing low of 1.1615.
On the flip side, if there is an upward correction, the pair might face resistance near 1.1680. Above this, the previous support at 1.1700 is likely to act as a resistance.
Overall, the recent downside break in EUR/USD has opened the doors for more losses below 1.1640. If the current trend remains intact, there is even a risk of more declines below the 1.1600 level.
Today, the Euro Zone CPI report for June 2018 is scheduled for the release. The market forecast is +0.1% (MoM), less than the last +0.5%. If the actual result misses the forecast, there could an increase in selling pressure on EUR/USD. If the CPI registers more than 0.2% rise, there could be a recovery towards the 1.1700 resistance.
USD/JPY Technical Analysis
The US Dollar surged during the past few days above 112.00 resistance the Japanese Yen. The USD/JPY pair climbed above the 112.60 pivot level and traded above the 113.00 resistance.
A new weekly high was formed at 113.08 before the pair corrected lower. It recently tested the 23.6% Fib retracement level of the last wave from the 112.23 low to 113.08 high. It seems like the pair remains well supported above the 112.60 level and the 50 hourly simple moving average.
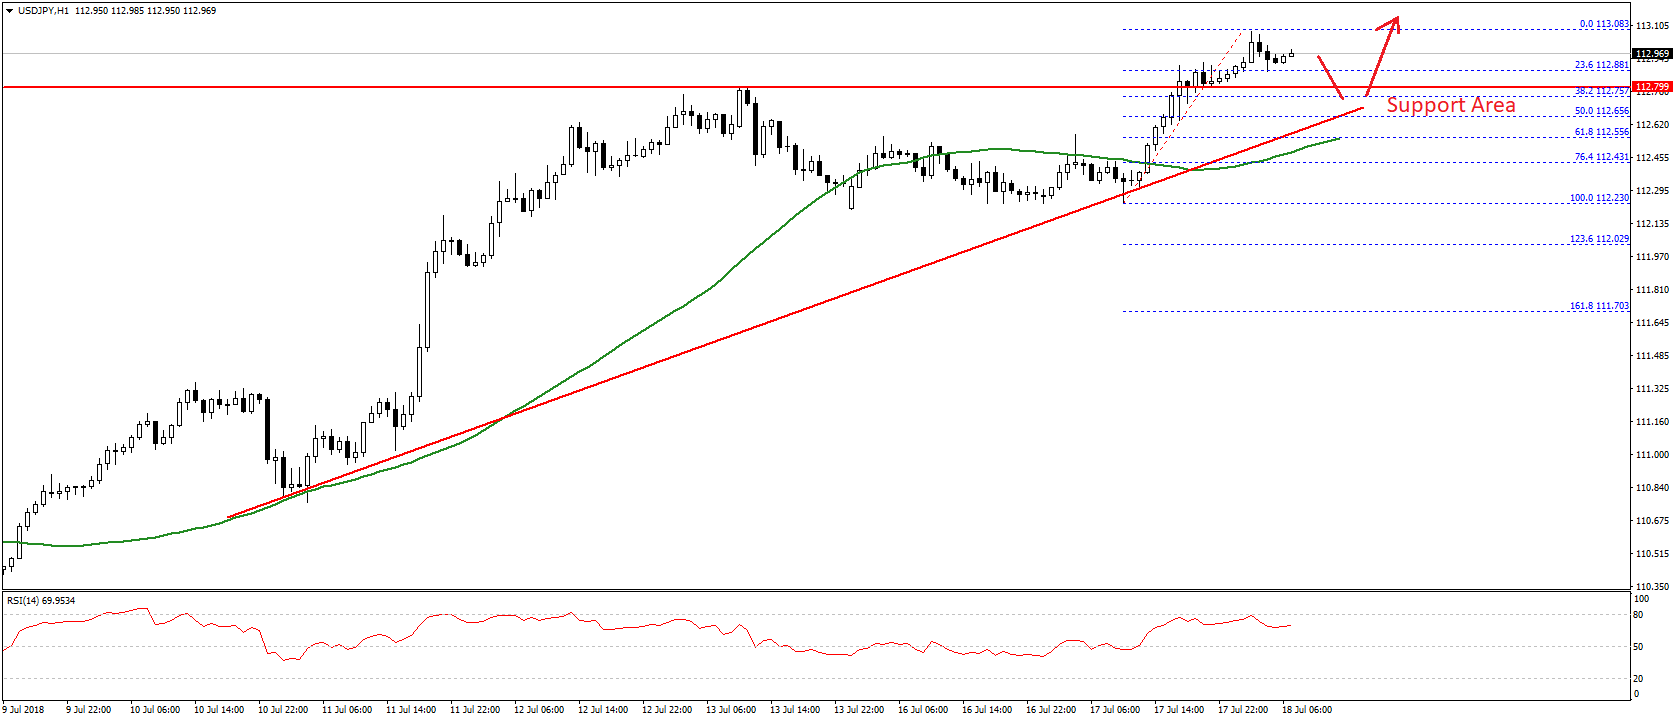
On the downside, there is also a crucial bullish trend line in place with support at 112.65 on the hourly chart. The trend line support is aligned with the 50% Fib retracement level of the last wave from the 112.23 low to 113.08 high.
Therefore, if the pair corrects lower towards 112.60-70, it is likely to find support. Below this, the pair may well drop back towards the 112.00 support.
On the upside, a push above the 113.08 high may open the doors for a surge towards the next crucial hurdle at 114.00 in the near term.
Trade over 50 forex markets 24 hours a day with FXOpen. Take advantage of low commissions, deep liquidity, and spreads from 0.0 pips. Open your FXOpen account now or learn more about trading forex with FXOpen.
This article represents the opinion of the Companies operating under the FXOpen brand only. It is not to be construed as an offer, solicitation, or recommendation with respect to products and services provided by the Companies operating under the FXOpen brand, nor is it to be considered financial advice.
Latest from Forex Analysis
Latest articles

Is There the Best Time to Trade Stock CFDs?
If you ask experienced traders, many will say that they trade on certain days or at certain times of the day. Their choice is determined by the market dynamics, volatility, and liquidity. It’s crucial to understand when the best

UnitedHealth (UNH) Share Price Surges after Strong Report
UnitedHealth shares surged Tuesday, rising more than 5% after the health care giant delivered stronger-than-expected first-quarter 2024 results:
→ earnings per share: actual = USD 6.91, expected = USD 6.61, last quarter = USD 6.16;
→ gross income: actual = USD 94.4

USD/JPY Analysis: Prospect of a Breakout of the Level of 155 Yen per Dollar
The USD/JPY rate has consistently reached new highs since 1990, approaching the psychological level of 155 yen per US dollar. The Japanese currency has already fallen about 9% against the dollar this year.
This is supported by Jerome Powell,