


FXOpen
EUR/USD failed to break the 1.1610 resistance and declined recently. On the other hand, USD/JPY broke the 112.00 resistance to move into a positive zone.
Important Takeaways for EUR/USD and USD/JPY
- The Euro failed to break the 1.1610 and 1.1620 resistance levels, and declined.
- There was a break below a major bullish trend line with support at 1.1575 on the hourly chart of EUR/USD.
- USD/JPY broke a key bearish trend line with resistance at 112.00 on the hourly chart.
- The pair may well continue to move higher towards the 112.50 and 112.60 levels.
EUR/USD Technical Analysis
The Euro traded with a positive bias above the 1.1550 support area against the US Dollar. However, the EUR/USD pair failed to hold gains above the 1.1600 support area.
The pair failed on multiple occasions to clear the 1.1610 and 1.1620 resistance levels, which resulted in a downside reaction. Sellers took control and pushed the pair below the 1.1590 support level and the 50 hourly simple moving average.
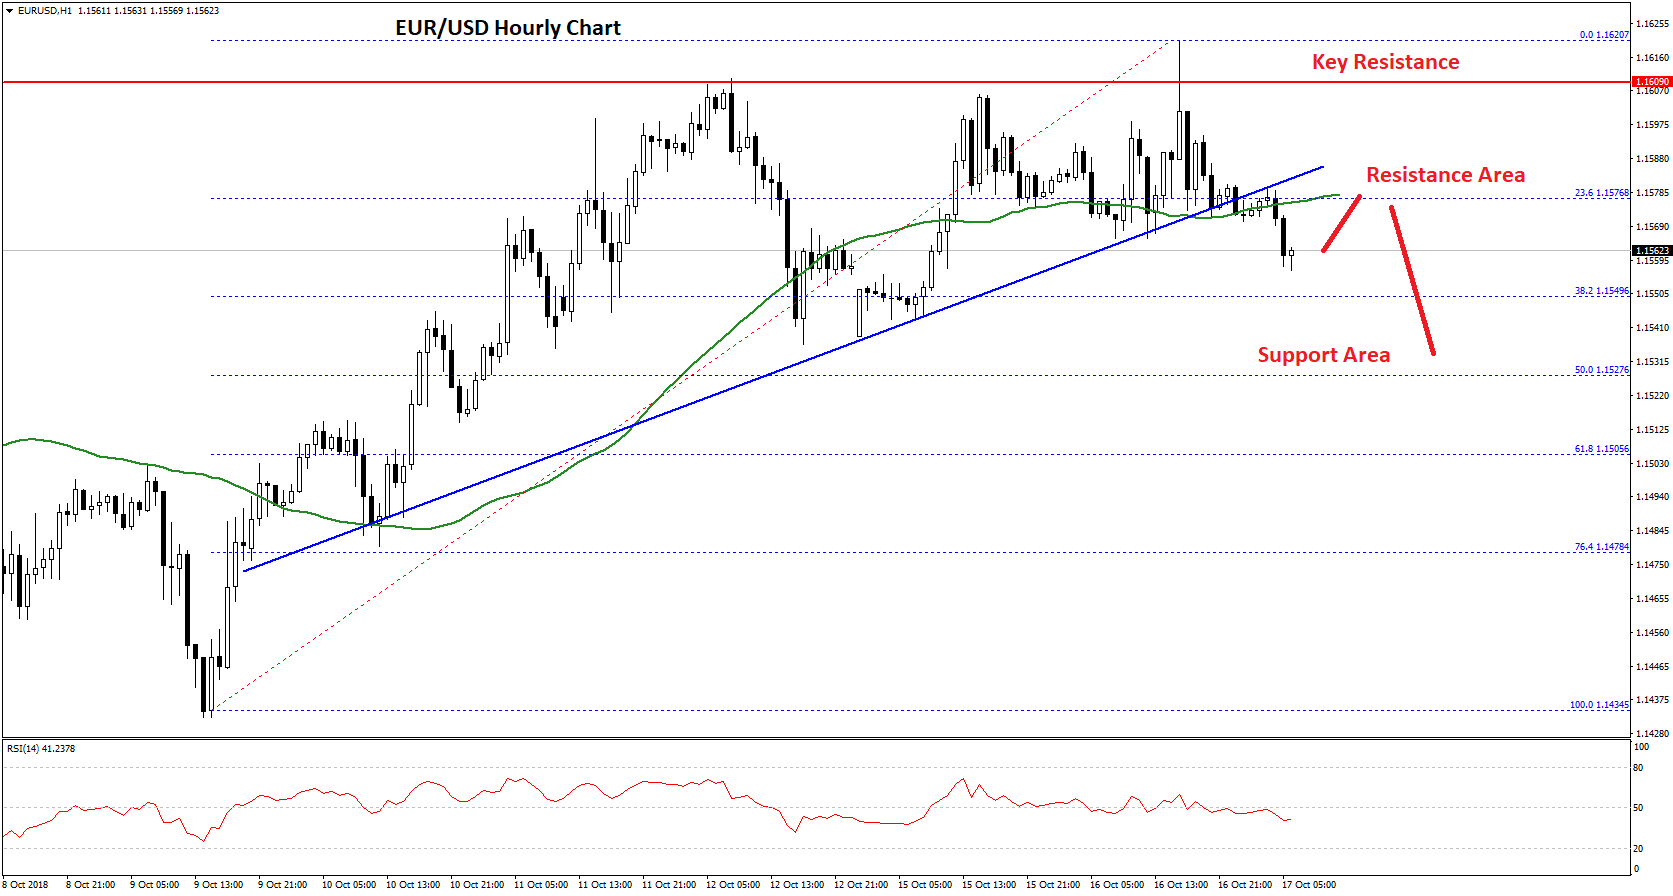
During the decline, the pair broke the 23.6% Fib retracement level of the last wave from the 1.1434 low to 1.1620 high. More importantly, there was a break below a major bullish trend line with support at 1.1575 on the hourly chart of EUR/USD.
The pair is currently trading with a bearish angle below the 1.1580 level and it may continue to move down towards the 1.1550 support. However, the most important support on the downside is near the 1.1525 since it is close to the 50% Fib retracement level of the last wave from the 1.1434 low to 1.1620 high.
If there is an upside correction, the broken support near 1.1580 and the 50 hourly SMA are likely to act as hurdles for buyers. Overall, it seems like EUR/USD is currently at a risk of more losses as long as it is below 1.1580 and 1.1610.
USD/JPY Technical Analysis
The US Dollar found a strong buying interest near the 111.50-60 zone low against the Japanese Yen. The USD/JPY pair traded as low as 111.62 and later it started an upside move.
The pair traded higher and it managed to break the 111.80 resistance and the 50 hourly simple moving average. It opened the doors for more gains and the pair climbed above the 112.00 resistance.
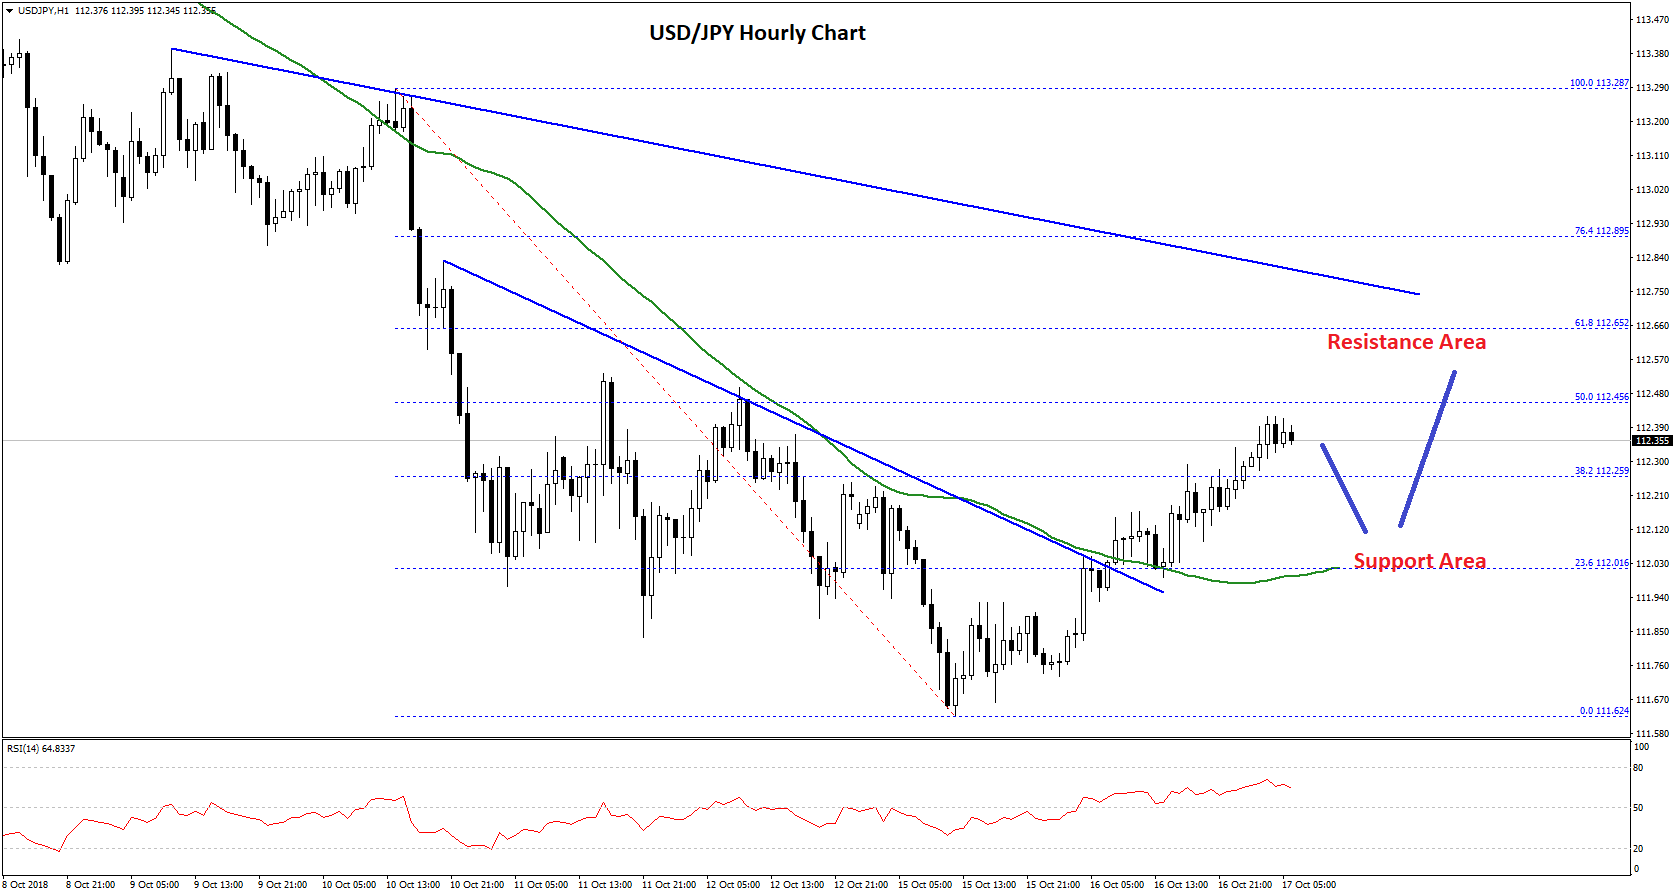
There was a break above the 23.6% Fib retracement level of the last decline from the 113.28 high to 111.62 low. Moreover, the pair broke a key bearish trend line with resistance at 112.00 on the hourly chart.
The pair is currently placed nicely above the 112.10 level and the 50 hourly SMA. The next key resistance on the upside is near the 112.50 and the 50% Fib retracement level of the last decline from the 113.28 high to 111.62 low.
Above 112.50, there is a bearish trend line in place on the same chart with resistance at 112.75, which is likely to act as a hurdle for buyers.
If there is a downside correction from the current levels, the previous resistance near 112.00 and the 50 hourly SMA are likely to act as supports.
Overall, USD/JPY is placed nicely in an uptrend above the 112.00 level and there could be more gains towards 112.50 or 112.75.
Trade over 50 forex markets 24 hours a day with FXOpen. Take advantage of low commissions, deep liquidity, and spreads from 0.0 pips. Open your FXOpen account now or learn more about trading forex with FXOpen.
This article represents the opinion of the Companies operating under the FXOpen brand only. It is not to be construed as an offer, solicitation, or recommendation with respect to products and services provided by the Companies operating under the FXOpen brand, nor is it to be considered financial advice.
Latest from Forex Analysis
Latest articles

Google Share Price Rose Post-market to a New All-time Record
Yesterday, after the close of the main trading session, a report on activities for the 1st quarter of Alphabet Inc. (Google's parent company) was published. The report was strong, exceeding investors' expectations.
→ Quarterly EPS = USD 1.89 (expected = USD 1.

S&P 500 Rebounds after Negative GDP News
Data released yesterday showed US GDP growth slowed to 1.6% in the first quarter of the year. According to ForexFactory: forecast = 2.2%, past value = 2.4%.
Reaction to the news sent the S&P 500 mini stock

GBP/USD And USD/CAD Daily Chart Outlook
GBP/USD is attempting a recovery wave from 1.2300. USD/CAD is consolidating and might aim for a move above the 1.3760 resistance zone.
Important Takeaways for GBP/USD and USD/CAD Analysis Today
· The British Pound started