


FXOpen
EUR/USD started an upside correction after testing the 1.1440 support. USD/CHF formed a short-term top at 0.9950 and later started a downside correction.
Important Takeaways for EUR/USD and USD/CHF
- The Euro found support near the 1.1440 and 1.1430 levels and recovered against the US Dollar.
- There was a break above a key bearish trend line with resistance at 1.1500 on the hourly chart of EUR/USD.
- USD/CHF formed a double top pattern near the 0.9950 level and declined recently.
- There was a break below a major bullish trend line with support at 0.9925 on the hourly chart.
EUR/USD Technical Analysis
The Euro was under a lot of pressure this past week as it broke the 1.1560 support level against the US Dollar. The EUR/USD pair declined sharply and even broke the 1.1500 and 1.1480 support levels.
Later, buyers took a stand near the 1.1440 and 1.1430 support levels. As a result, the pair started a decent recovery and moved above the 1.1480 resistance. There was a break above the 50% Fib retracement level of the last decline from the 1.1549 high to 1.1432 low.
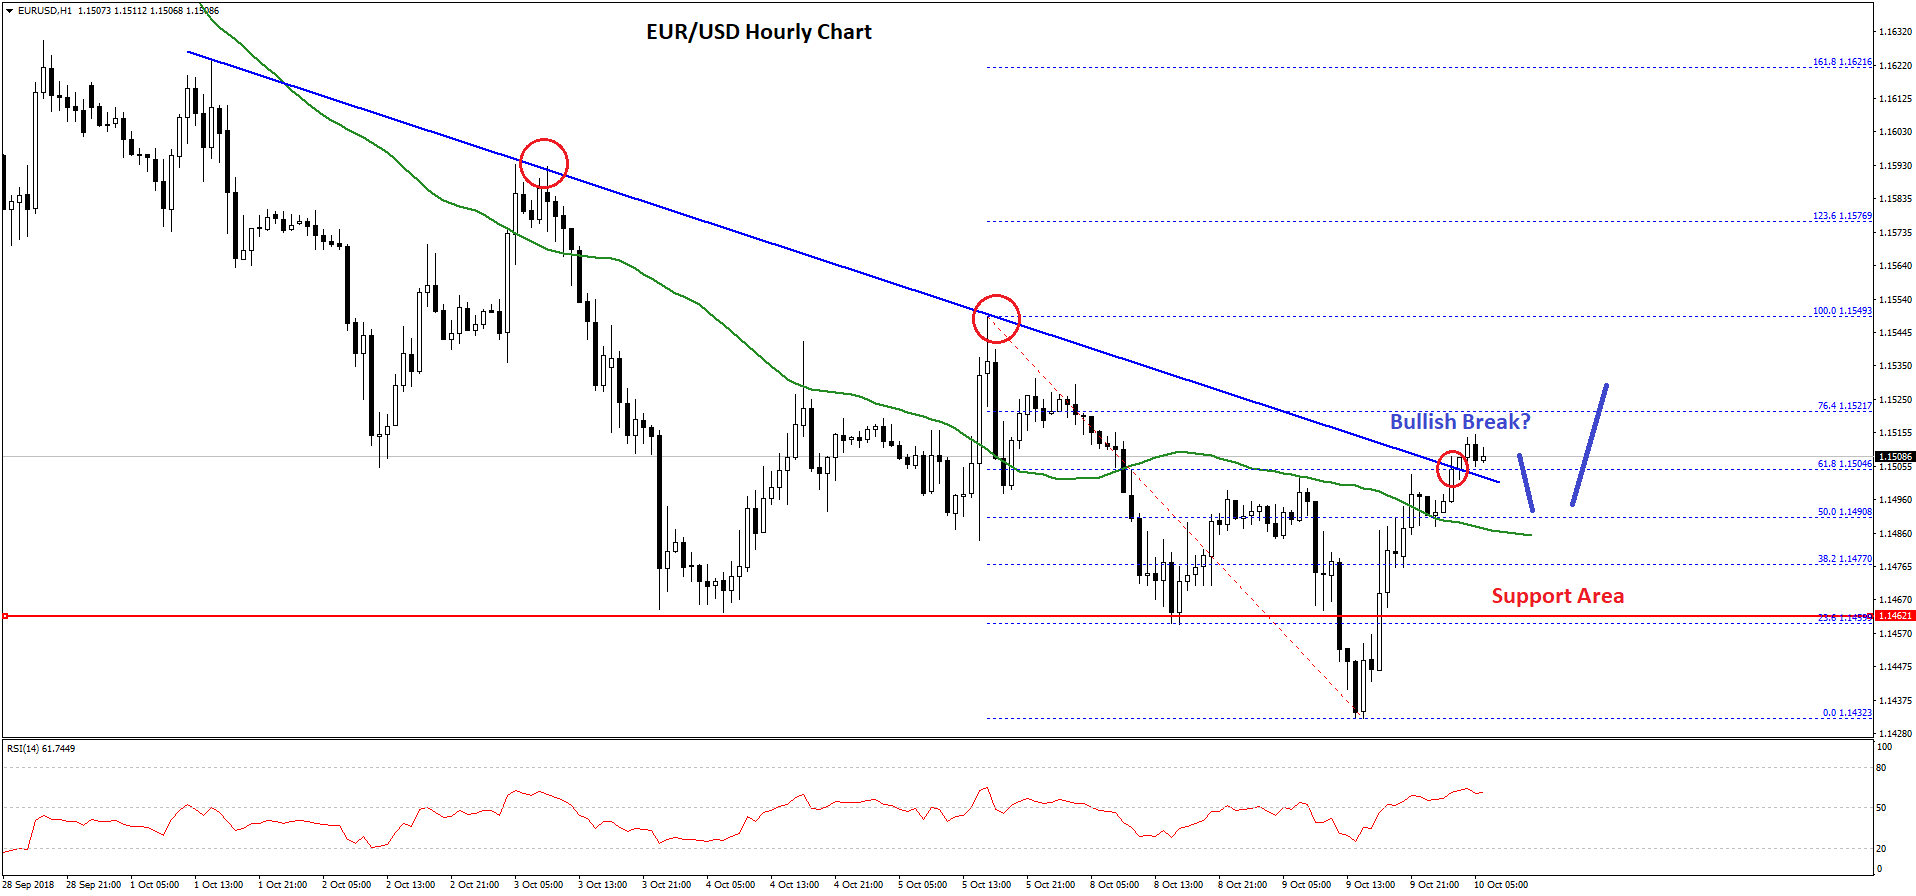
The pair succeeded in settling above the 1.1500 level and the 50 hourly simple moving average. More importantly, there was a break above a key bearish trend line with resistance at 1.1500 on the hourly chart.
It has opened the doors for more gains above the 1.1520 level in the near term. An immediate resistance for buyers is near the 1.1520 and the 76.4% Fib retracement level of the last decline from the 1.1549 high to 1.1432 low.
Above 1.1520, the pair is likely to visit the 1.1550 and 1.1580 levels in the near term. On the other hand, if there is a downside correction, the broken resistance at 1.1480 and the 50 hourly SMA are likely to act as key supports for buyers.
Overall, the recent break in EUR/USD is positive and it could help the pair is moving higher towards the 1.1550 and 1.1580 levels.
USD/CHF Technical Analysis
The US Dollar remained in a bullish zone above the 0.9900 level this past week against the Swiss franc. However, the USD/CHF pair struggled to move above the 0.9950 and 0.9960 resistance levels.
It seems like there were two rejections noted around the 0.9955 level. It means the pair likely formed a double top pattern and declined below the 0.9920 support. During the decline, the pair broke the 0.9915 support and settled below the 50 hourly simple moving average.
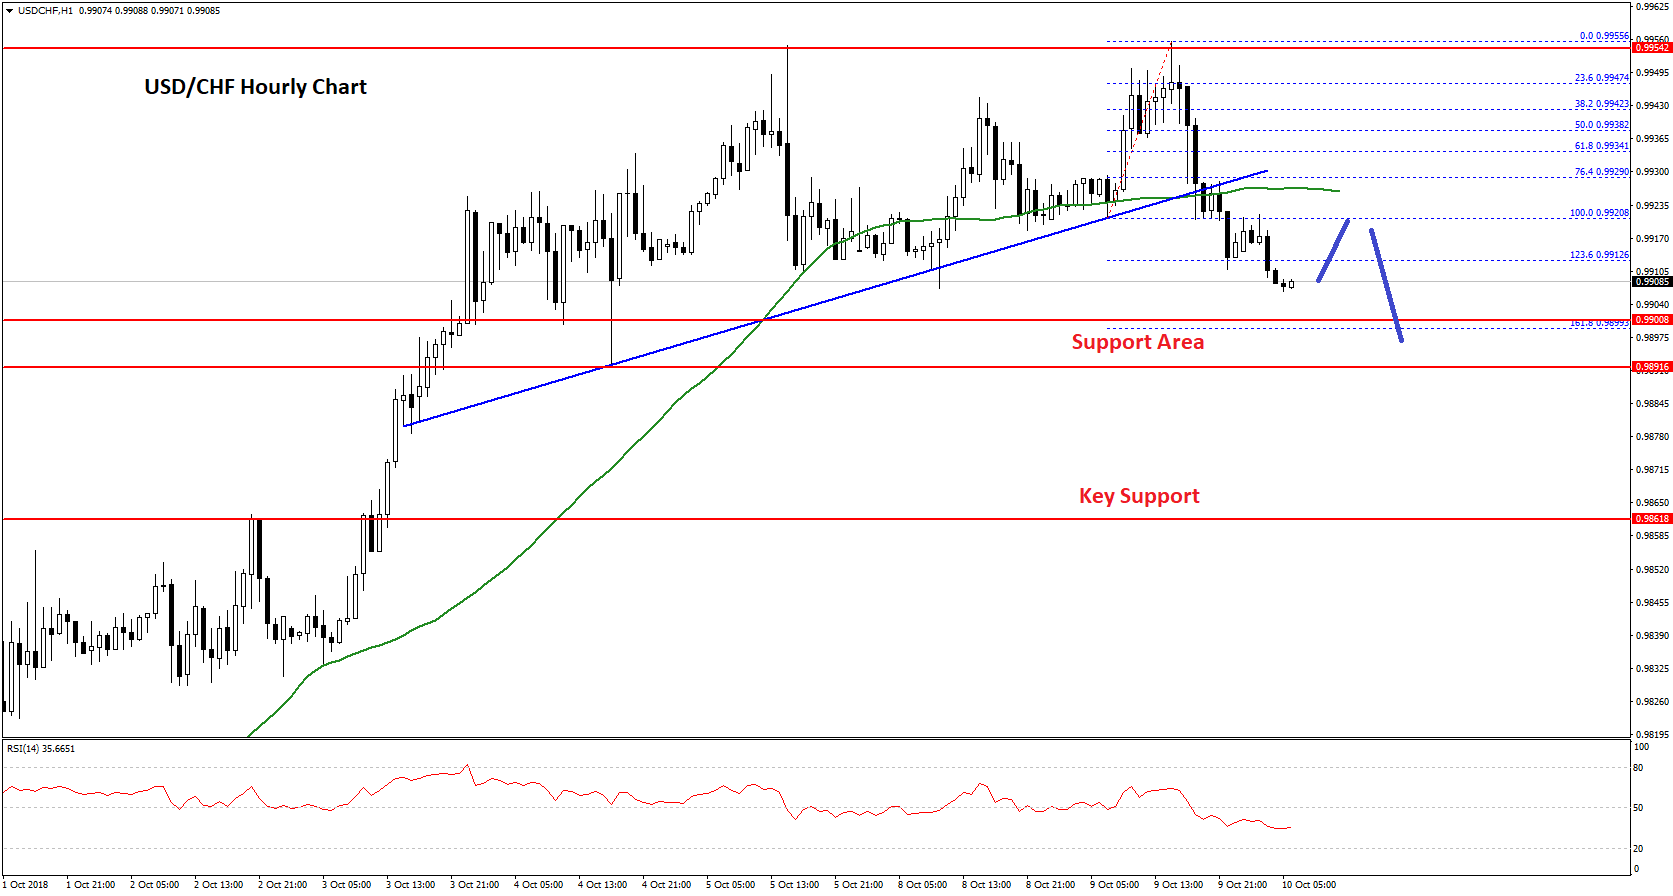
Moreover, there was a break below a major bullish trend line with support at 0.9925 on the hourly chart. The pair even traded below the 1.236 Fib extension level of the last wave from the 0.9920 low to 0.9955 high.
It means there are high chances of more losses below the 0.9900 level in the near term. The next support awaits near 0.9890 and the 1.618 Fib extension level of the last wave from the 0.9920 low to 0.9955 high.
If the pair continues to move down, it could test the next major support at 0.9860 where buyers are likely to emerge. On the upside, an initial resistance is around 0.9930 and the 50 hourly SMA.
Above 0.9930, USD/CHF could revisit the 0.9950 and 0.9960 resistance levels. Overall, the pair remains at a risk of more losses below 0.9900 in the near term.
Trade over 50 forex markets 24 hours a day with FXOpen. Take advantage of low commissions, deep liquidity, and spreads from 0.0 pips. Open your FXOpen account now or learn more about trading forex with FXOpen.
This article represents the opinion of the Companies operating under the FXOpen brand only. It is not to be construed as an offer, solicitation, or recommendation with respect to products and services provided by the Companies operating under the FXOpen brand, nor is it to be considered financial advice.
Latest from Forex Analysis
Latest articles

Weekly Market Wrap With Gary Thomson: UK100, USD, GOLD, OIL
Get the latest scoop on the week's hottest headlines, all in one convenient video. Join Gary Thomson, the COO of FXOpen UK, as he breaks down the most significant news reports and shares his expert insights.
- UK100 Share Index Rises

What Is a Darvas Box Theory and How Does It Work in Trading?
The Darvas Box Theory, pioneered by Nicolas Darvas in the 1950s, has transcended its stock market origins to become a valuable tool for forex traders. This method leverages specific price movements and patterns, known as the Darvas Box, to track

NFLX Stock Price Falls Despite Subscriber Growth
Yesterday, after the close of the main trading session on the stock market, Netflix reported to investors for the 1st quarter of 2024.
The report turned out better than expected:
→ earnings per share: actual = USD 5.28, forecast = USD 4.