


FXOpen
EUR/USD topped near the 1.1575 level and later corrected lower sharply. USD/JPY is currently consolidating and it could soon make the next move above 108.75.
Important Takeaways for EUR/USD and USD/JPY
- The Euro declined recently and broke the 1.1460 and 1.1420 support levels.
- There is a major bearish trend line formed with resistance at 1.1445 on the hourly chart of EUR/USD.
- USD/JPY is gaining strength above the 108.00 and 108.20 support levels.
- There is a key contracting triangle formed with resistance at 108.65 on the hourly chart.
EUR/USD Technical Analysis
The Euro traded above the 1.1500 resistance this past week against the US Dollar. The EUR/USD pair traded towards the 1.1580 level and later started a sharp downward move.
The pair traded below the 1.1500, 1.1460 and 1.1420 support levels to move into a bearish zone. There was even a close below the 1.1420 support level and the 50 hourly simple moving average. A low was formed at 1.1382 on FXOpen and the pair is currently correcting higher.
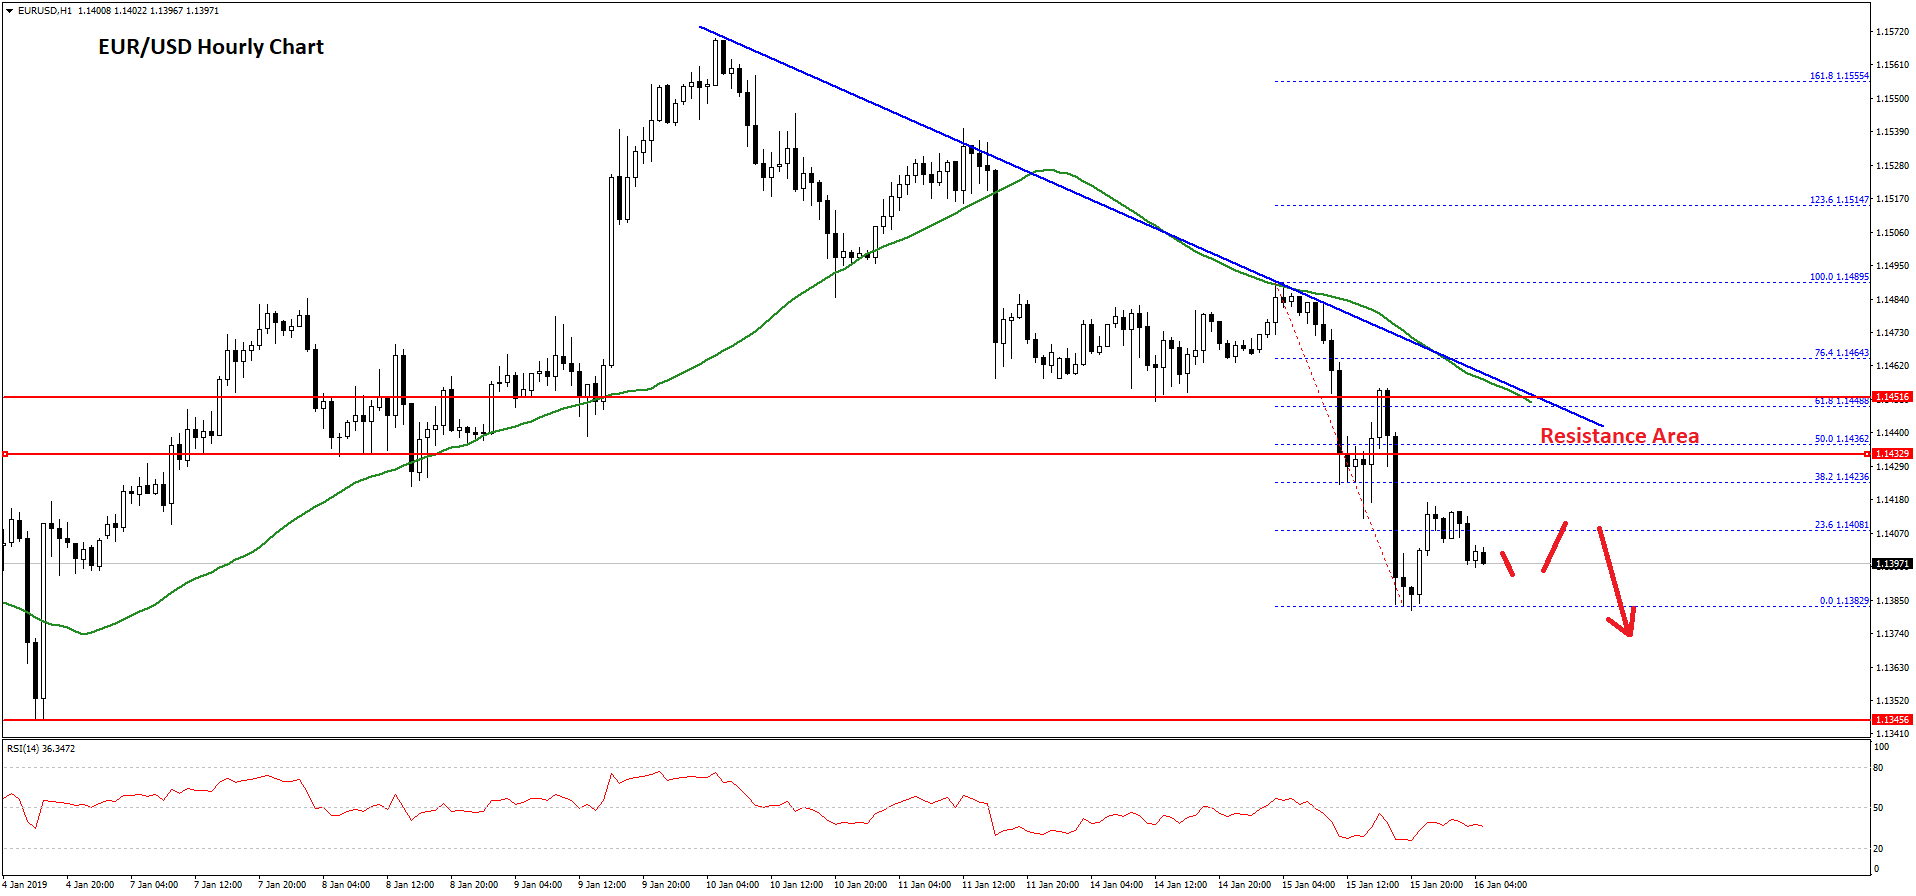
It traded above the 23.6% Fib retracement level of the recent decline from the 1.1489 high to 1.1382 low. However, there are many hurdles for buyers on the upside near the 1.1420, 1.1430 and 1.1440 levels.
There is also a major bearish trend line formed with resistance at 1.1445 on the hourly chart of EUR/USD. The trend line coincides with the 50% Fib retracement level of the recent decline from the 1.1489 high to 1.1382 low.
Therefore, if there is an upside correction, the pair is likely to struggle near the 1.1420, 1.1430 and 1.1440 resistance levels. On the downside, an initial support is at 1.1380, below which the pair may test the 1.1350 support level.
On the flip side, if there is a close above the trend line and the 50 hourly SMA, EUR/USD could move back in a positive zone towards 1.1500.
USD/JPY Technical Analysis
The US Dollar declined below the 108.50 level recently before buyers appeared near 107.80 against the Japanese Yen. The USD/JPY pair started a fresh upward move and traded above the 108.00 and 108.20 resistance levels.
The pair traded as high as 108.74 recently and later started trading in a range. It declined below the 38.2% Fib retracement level of the last wave from the 107.94 low to 108.76 high.
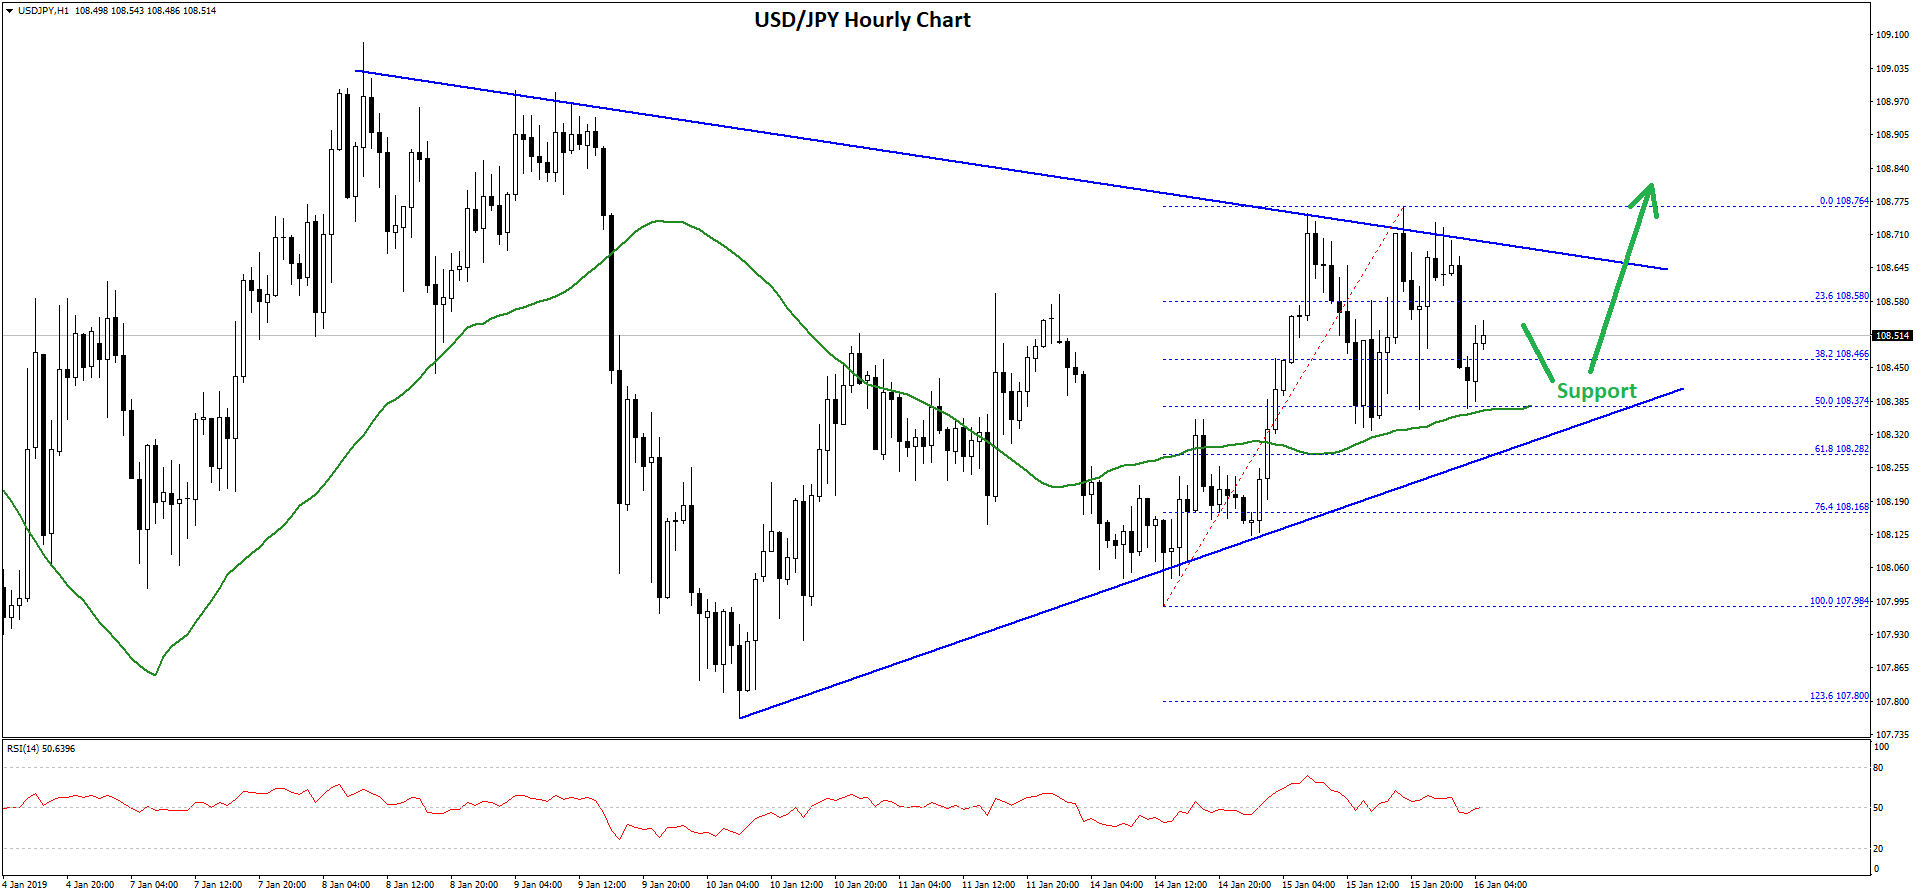
However, the 108.40 level acted as a solid support along with the 50 hourly simple moving average. Moreover, the 50% Fib retracement level of the last wave from the 107.94 low to 108.76 high also acted as a support.
At the moment, the pair is trading in a range above 108.40 and it is likely preparing for the next move. There is also a key contracting triangle formed with resistance at 108.65 on the hourly chart.
If there is an upside break above the 108.65 and 108.70 levels, the pair may climb towards the 109.00 and 109.40 levels. On the other hand, a downside break below 108.40 and 108.20 could start a fresh decline to 108.00 and 107.80.
Overall, the pair remains primed for more gains as long as it is trading above the 108.20 support area in the near term.
Trade over 50 forex markets 24 hours a day with FXOpen. Take advantage of low commissions, deep liquidity, and spreads from 0.0 pips. Open your FXOpen account now or learn more about trading forex with FXOpen.
This article represents the opinion of the Companies operating under the FXOpen brand only. It is not to be construed as an offer, solicitation, or recommendation with respect to products and services provided by the Companies operating under the FXOpen brand, nor is it to be considered financial advice.
Latest from Forex Analysis
Latest articles

Google Share Price Rose Post-market to a New All-time Record
Yesterday, after the close of the main trading session, a report on activities for the 1st quarter of Alphabet Inc. (Google's parent company) was published. The report was strong, exceeding investors' expectations.
→ Quarterly EPS = USD 1.89 (expected = USD 1.

S&P 500 Rebounds after Negative GDP News
Data released yesterday showed US GDP growth slowed to 1.6% in the first quarter of the year. According to ForexFactory: forecast = 2.2%, past value = 2.4%.
Reaction to the news sent the S&P 500 mini stock

GBP/USD And USD/CAD Daily Chart Outlook
GBP/USD is attempting a recovery wave from 1.2300. USD/CAD is consolidating and might aim for a move above the 1.3760 resistance zone.
Important Takeaways for GBP/USD and USD/CAD Analysis Today
· The British Pound started