


FXOpen
EUR/USD recovered recently and traded above the 1.1350 resistance to move into a positive zone. USD/JPY declined heavily and it seems like it could break the 112.25 support.
Important Takeaways for EUR/USD and USD/JPY
- The Euro corrected higher recently and traded above the 1.1300 and 1.1350 levels.
- There was a break above a key bearish trend line with resistance at 1.1352 on the hourly chart of EUR/USD.
- USD/JPY declined heavily and broke the 113.20 and 113.00 support levels.
- There is a bearish trend line formed with resistance at 112.45 on the hourly chart.
EUR/USD Technical Analysis
The Euro declined below the 1.1300 support level this past week against the US Dollar. The EUR/USD pair even broke the 1.1280 support zone before buyers appeared near the 1.1265 level.
The pair traded as low as 1.1269 on FXOpen and later started a decent upside correction. It climbed above the 1.1300 resistance area and settled above the 50 hourly simple moving average. Besides, there was a break above the 61.8% Fib retracement level of the last decline from the 1.1392 high to 1.1269 low.
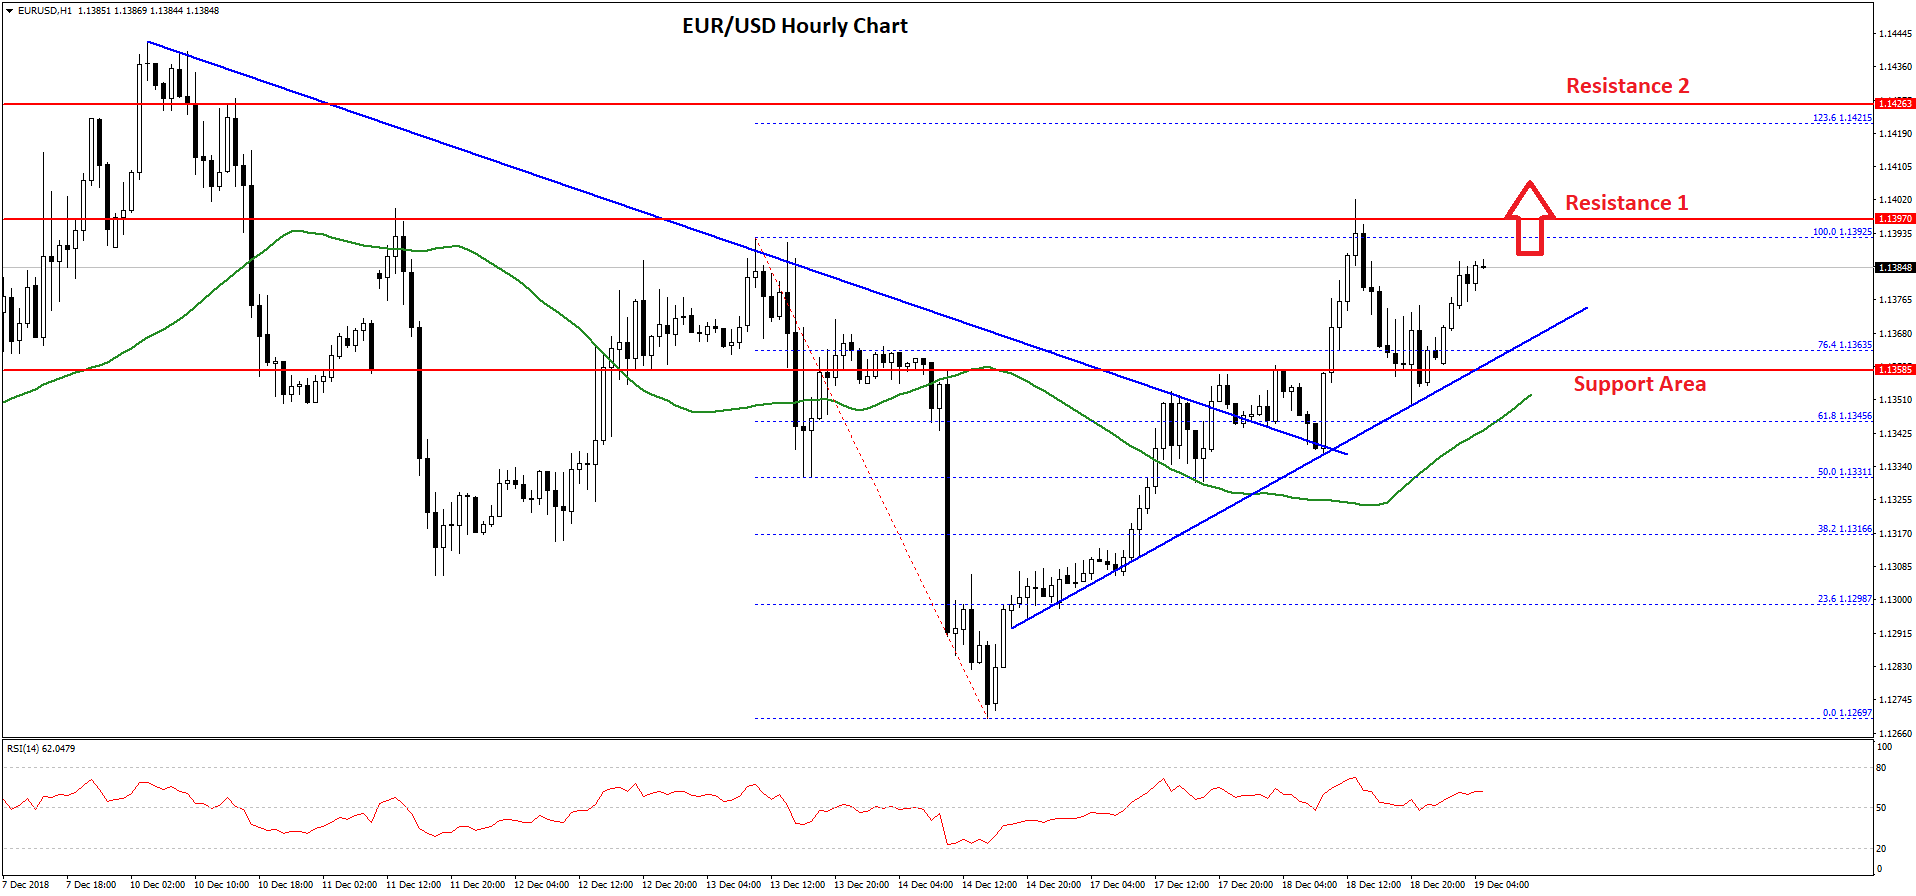
Moreover, there was a break above a key bearish trend line with resistance at 1.1352 on the hourly chart. The pair is now trading just below the last swing high of 1.1392. Therefore, there are chances of more gains above 1.1390 and 1.1400 in the near term.
Above 1.1400, the pair could test the 1.236 Fib extension level of the last decline from the 1.1392 high to 1.1269 low at 1.1421.
On the downside, there is a connecting bullish trend line formed with support at 1.1370, below which there is a solid support near the 1.1355 level (the previous resistance). Overall, the pair remains in an uptrend and it could accelerate above 1.1400 in the near term.
USD/JPY Technical Analysis
The US Dollar failed to trade close the 114.00 resistance area this past week against the Japanese Yen. The USD/JPY pair traded near the 113.70-113.75 area where sellers emerged.
Later, there was a downside break and the pair broke the 113.50 support and the 50 hourly simple moving average. Moreover, there was a break below an ascending channel with support at 113.35 on the hourly chart.
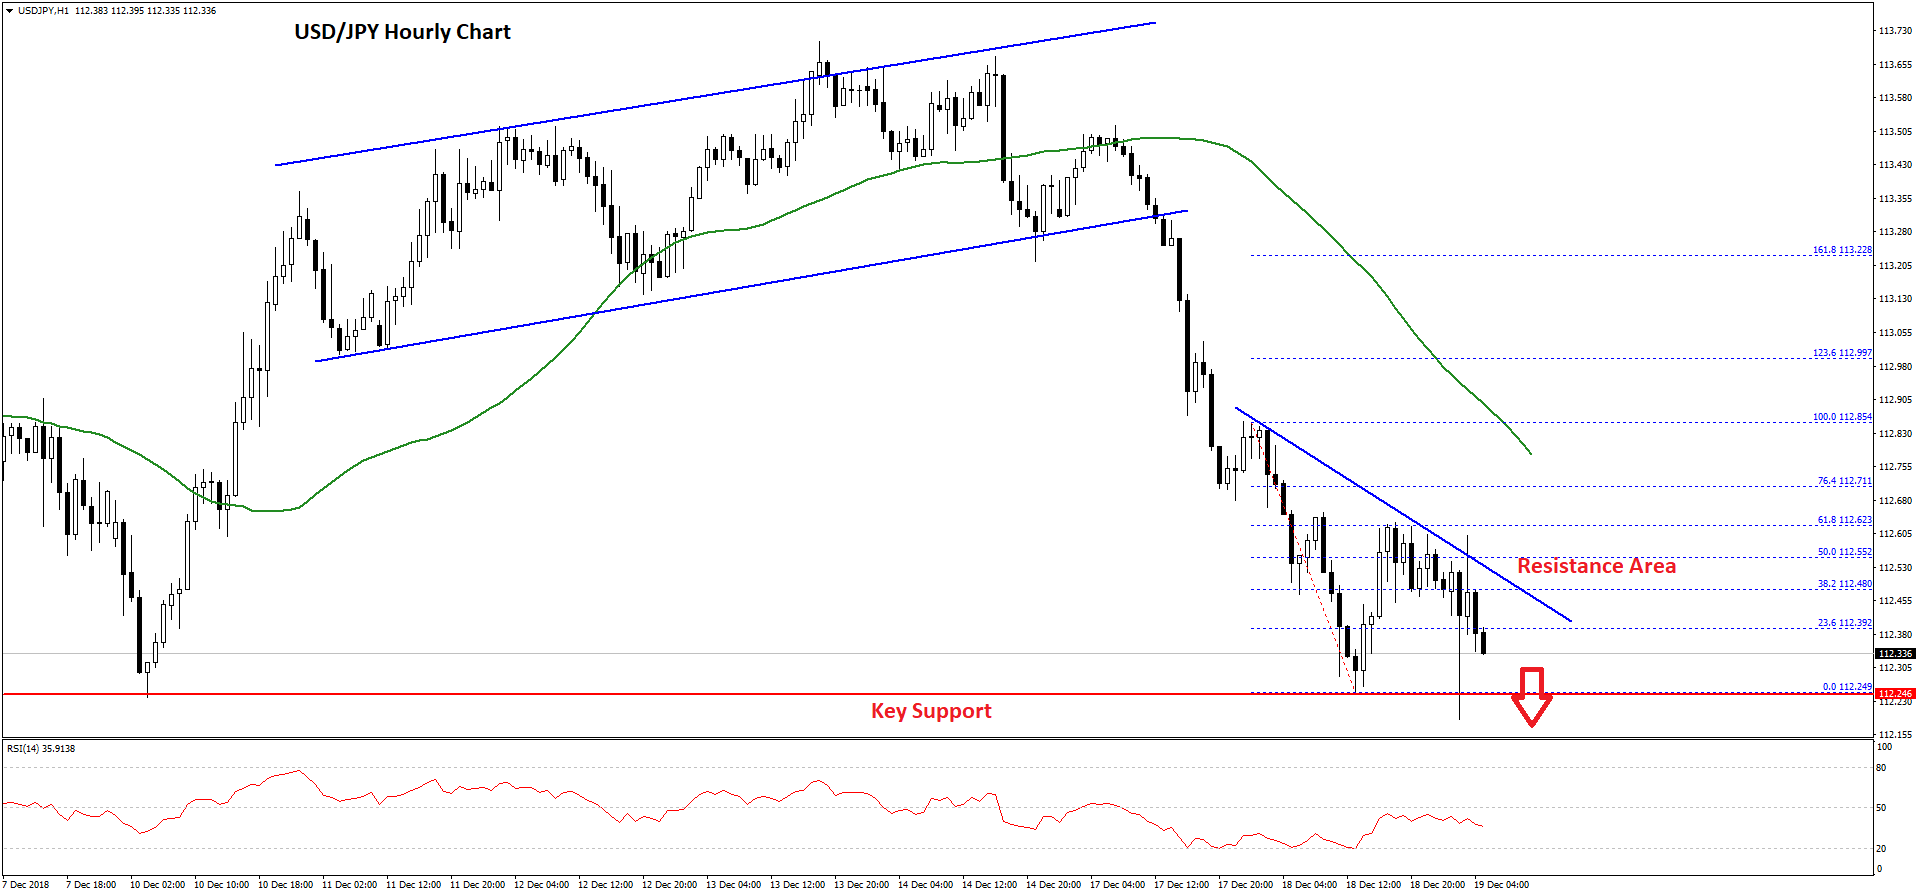
It opened the doors for more losses and the pair declined below the 113.20 and 113.00 support levels. It even broke the 112.50 support and tested the crucial 112.25 support area. Later, there was a correction above the 112.45 level and the 50% Fib retracement level of the recent decline from the 112.85 high to 112.24 low.
However, the upside move was capped by the 112.60 resistance and the 61.8% Fib retracement level of the recent decline from the 112.85 high to 112.24 low. There is also a bearish trend line formed with resistance at 112.45 on the hourly chart.
Therefore, there is a risk of more losses below the 112.25 support level in the near term. The next key support is at 112.00, below which USD/JPY ma even test the 111.60 support. On the upside, an initial resistance is near 112.45, above which the pair must surpass the 112.85 plus the 50 SMA to move into a positive zone.
Trade over 50 forex markets 24 hours a day with FXOpen. Take advantage of low commissions, deep liquidity, and spreads from 0.0 pips. Open your FXOpen account now or learn more about trading forex with FXOpen.
This article represents the opinion of the Companies operating under the FXOpen brand only. It is not to be construed as an offer, solicitation, or recommendation with respect to products and services provided by the Companies operating under the FXOpen brand, nor is it to be considered financial advice.
Latest from Forex Analysis
Latest articles

Google Share Price Rose Post-market to a New All-time Record
Yesterday, after the close of the main trading session, a report on activities for the 1st quarter of Alphabet Inc. (Google's parent company) was published. The report was strong, exceeding investors' expectations.
→ Quarterly EPS = USD 1.89 (expected = USD 1.

S&P 500 Rebounds after Negative GDP News
Data released yesterday showed US GDP growth slowed to 1.6% in the first quarter of the year. According to ForexFactory: forecast = 2.2%, past value = 2.4%.
Reaction to the news sent the S&P 500 mini stock

GBP/USD And USD/CAD Daily Chart Outlook
GBP/USD is attempting a recovery wave from 1.2300. USD/CAD is consolidating and might aim for a move above the 1.3760 resistance zone.
Important Takeaways for GBP/USD and USD/CAD Analysis Today
· The British Pound started