


FXOpen

EUR/USD declined recently below 1.1320 before it found support near 1.1280. USD/JPY is currently under pressure and it could continue to slide below 107.80 in the near term.
Important Takeaways for EUR/USD and USD/JPY
- The Euro is holding the 1.1280 support area after a major decline.
- There is a major bearish trend line in place with resistance near 1.1298 on the hourly chart of EUR/USD.
- USD/JPY started a crucial downward move after it failed to clear the 108.50 resistance.
- There was a break below a major bullish trend line with support near 108.15 on the hourly chart.
EUR/USD Technical Analysis
The Euro failed to hold gains above the 1.1400 level and recently started a fresh decline against the US Dollar. The EUR/USD pair traded below the 1.1350 and 1.1320 support levels to enter a bearish zone.
The decline was strong since there was a close below the 1.1320 level and the 50 hourly simple moving average. The pair even spiked below the 1.1280 support area and traded as low as 1.1275 on FXOpen.
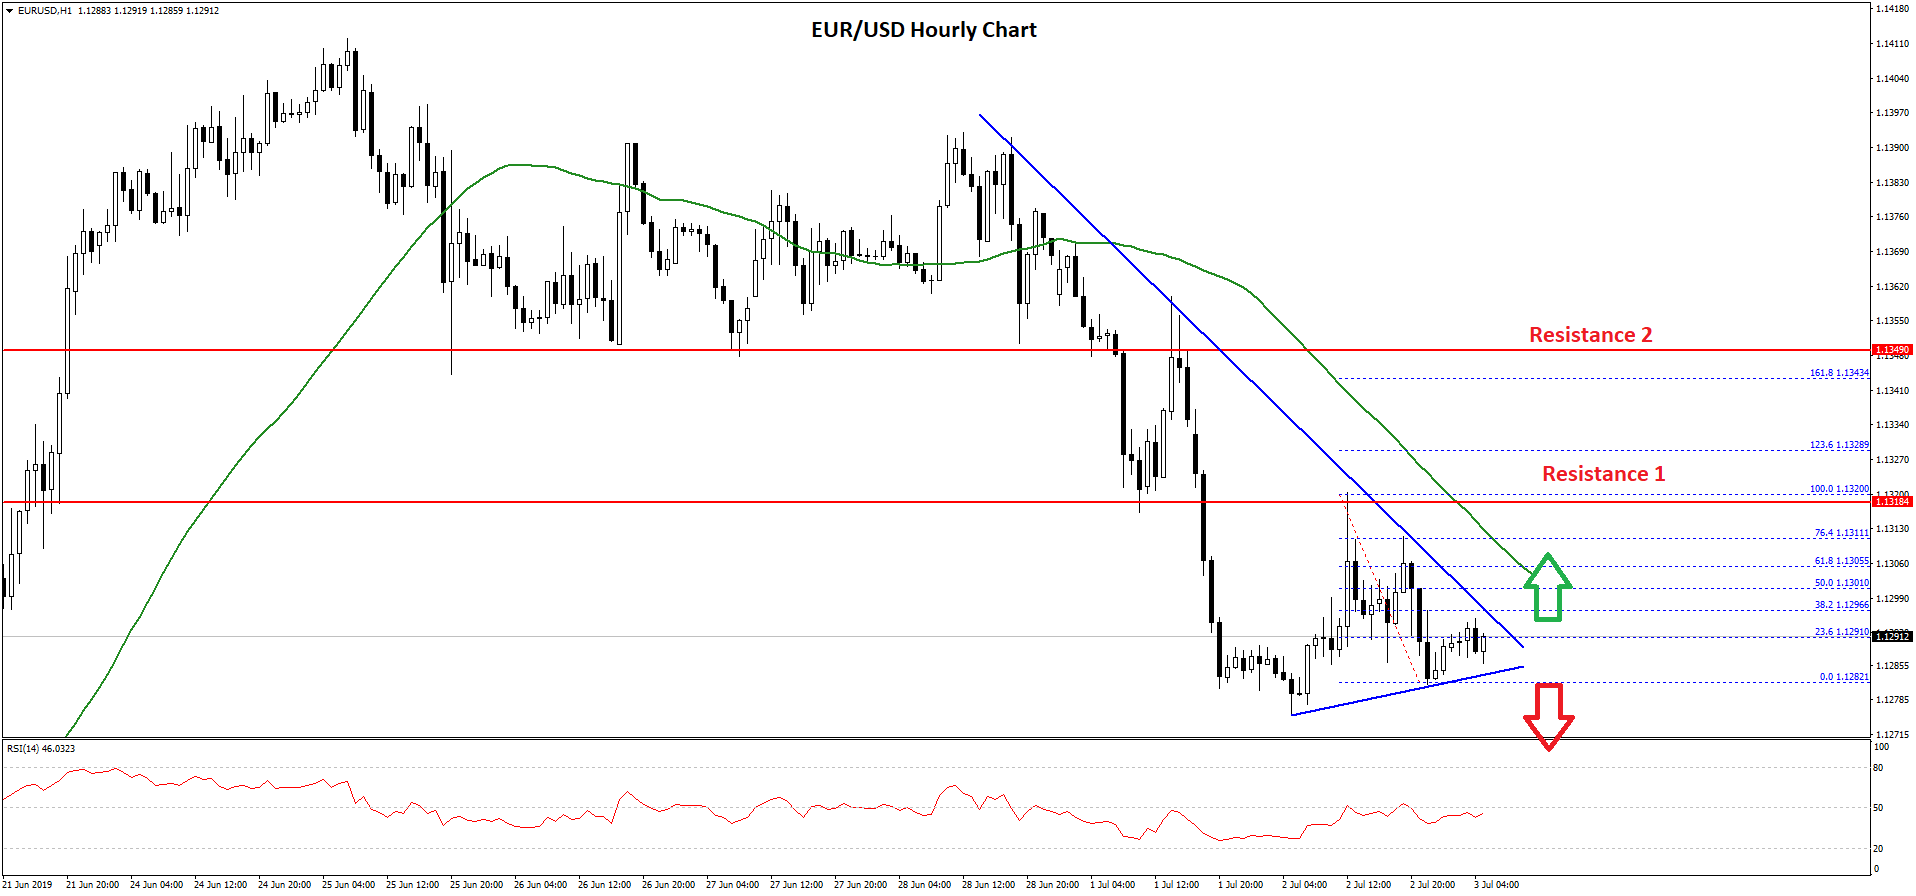
It recently recovered but the 1.1320 level acted as a resistance. Finally, the pair declined again, but the 1.1280 support area is acting as a decent support. It is currently consolidating near the 23.6% Fib retracement level of the recent decline from the 1.1320 high to 1.1282 low.
On the upside, there is a major bearish trend line in place with resistance near 1.1298 on the hourly chart of EUR/USD. Above the trend line, the 1.1300 level and the 50 hourly simple moving average might act as resistances.
Moreover, the 50% Fib retracement level of the recent decline from the 1.1320 high to 1.1282 low is also near the 1.1300 level. If there is an upside break above the 1.1300 level, the price could recover towards the 1.1320 level.
Conversely, if there is no upside break, EUR/USD might slide further below 1.1280. If there is a downside break below the 1.1175 low, there are chances of more losses below the 1.1165 and 1.1150 levels.
USD/JPY Technical Analysis
The US Dollar traded nicely above the 108.00 level until it faced a strong resistance near 108.50-108.60 against the Japanese Yen. The USD/JPY pair failed to continue higher and started a fresh decline.
It broke many supports near the 108.20 level. Moreover, there was a break below a major bullish trend line with support near 108.15 on the hourly chart.
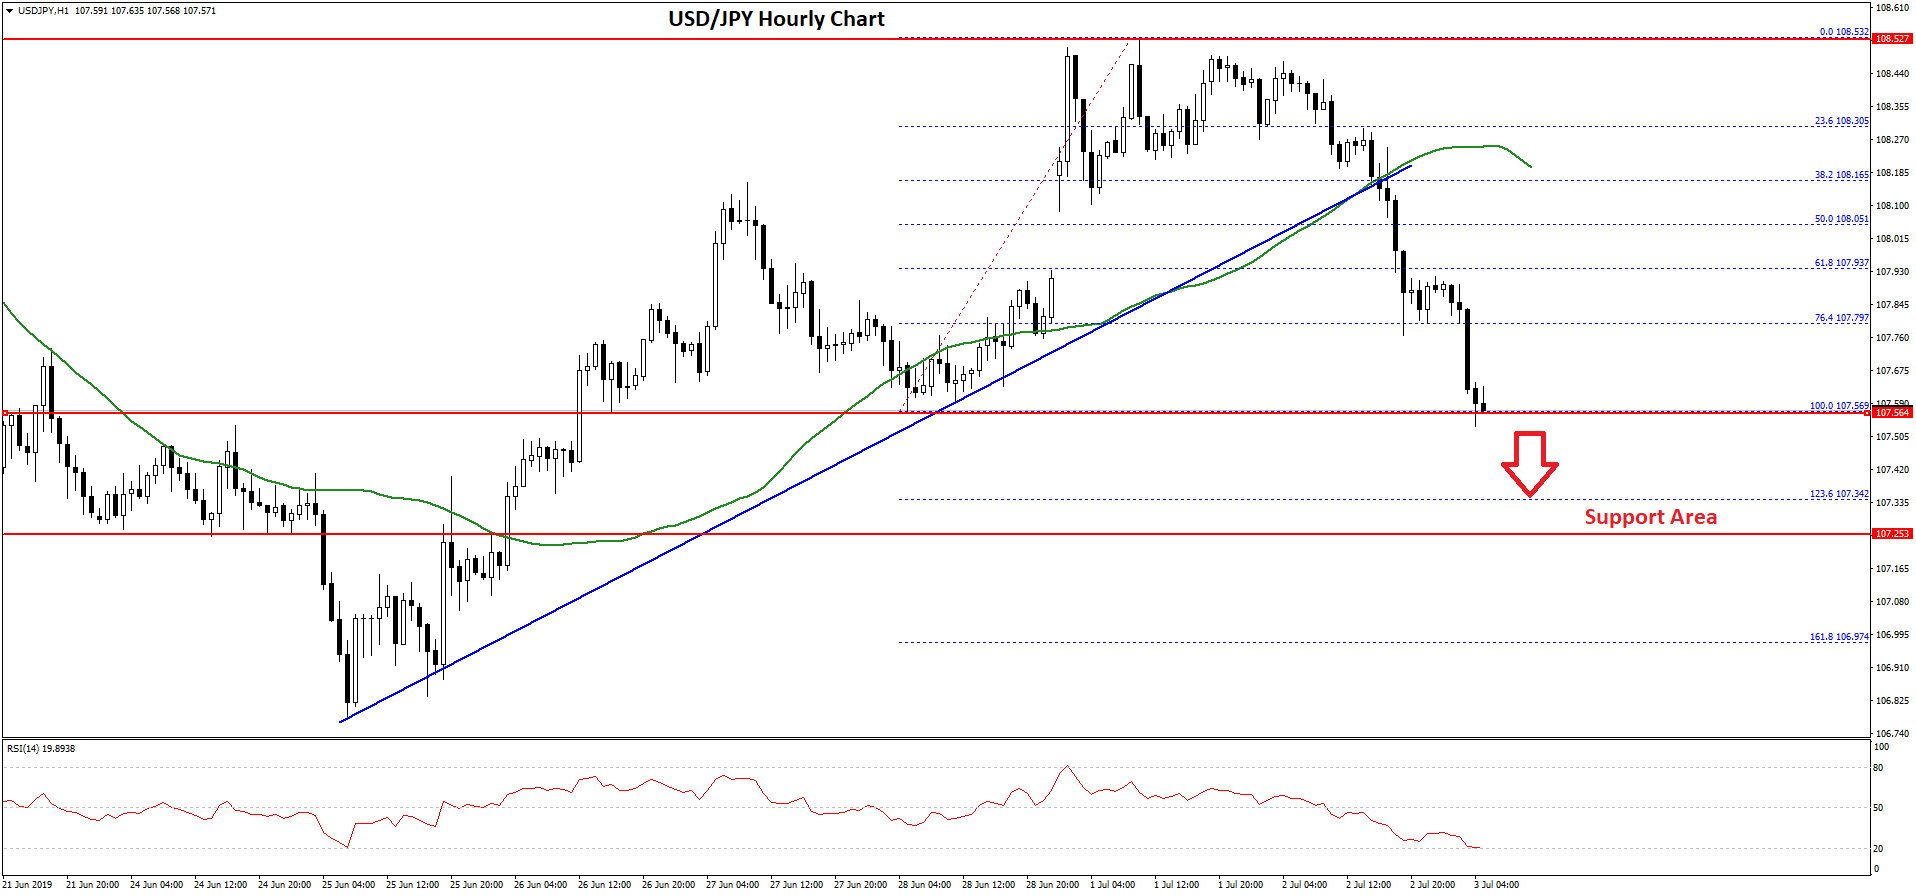
The pair even settled below the 108.00 level and the 50 hourly simple moving average. The decline was such that the pair traded below the 107.80 support plus the 76.4% Fib retracement level of the last wave from the 107.56 low to 108.53 high.
USD/JPY is currently trading near the last swing low at 107.55. If there is a downside break below 107.50, the pair could accelerate losses in the near term.
The next key support could be 107.35 or the 1.1236 Fib extension level of the last wave from the 107.56 low to 108.53 high. If there are more losses, the pair could even test the 107.25 support level.
Conversely, if the pair stays above the 107.50 support, it could start a fresh increase. On the upside, the main resistances are near the 107.80 and 108.00 levels.
Trade over 50 forex markets 24 hours a day with FXOpen. Take advantage of low commissions, deep liquidity, and spreads from 0.0 pips. Open your FXOpen account now or learn more about trading forex with FXOpen.
This article represents the opinion of the Companies operating under the FXOpen brand only. It is not to be construed as an offer, solicitation, or recommendation with respect to products and services provided by the Companies operating under the FXOpen brand, nor is it to be considered financial advice.
Latest from Forex Analysis
Latest articles

Since the Start of the Week, Brent Oil Price Has Dropped over 4%
At the beginning of the week, March 15, we wrote that the price of Brent oil could form a correction from the resistance level of USD 91 per barrel. Since then, the price has decreased by more than 4% due

Fair Value Gaps vs Liquidity Voids in Trading
Understanding fair value gaps and liquidity voids is essential for traders seeking to navigate the complexities of the financial markets. These concepts, deeply rooted in the Smart Money Concept (SMC), provide valuable insights into the dynamics of supply and demand,

UK100 Share Index Rises as UK Inflation Slows
Yesterday, the UK Office for National Statistics (ONS) reported that the CPI stood at 3.2% in March. According to ForexFactory, analysts expected 3.1%, and a month ago the index was 3.4%.
Grant Fitzner, chief economist at the