


FXOpen
EUR/USD recovered recently above 1.1200 and 1.1240, with positive signs. Conversely, there were strong losses in USD/JPY below the 109.00 and 108.50 support levels.
Important Takeaways for EUR/USD and USD/JPY
- The Euro started a strong upward move above the 1.1150 resistance level.
- There is a key bullish trend line in place with support near 1.1235 on the hourly chart of EUR/USD.
- USD/JPY declined heavily and traded below the 109.40 and 109.00 support levels.
- There is a short term breakout pattern forming with resistance near 108.30 on the hourly chart.
EUR/USD Technical Analysis
The Euro found support near the 1.1120 level and recently started an upward move against the US Dollar. The EUR/USD pair traded above the key 1.1180 and 1.1200 and 1.1220 resistance levels.
The pair gained strength above the 1.1230 level and the 50 hourly simple moving average. The pair even gained pace above the 1.1260 and traded as high as 1.1276 on FXOpen.
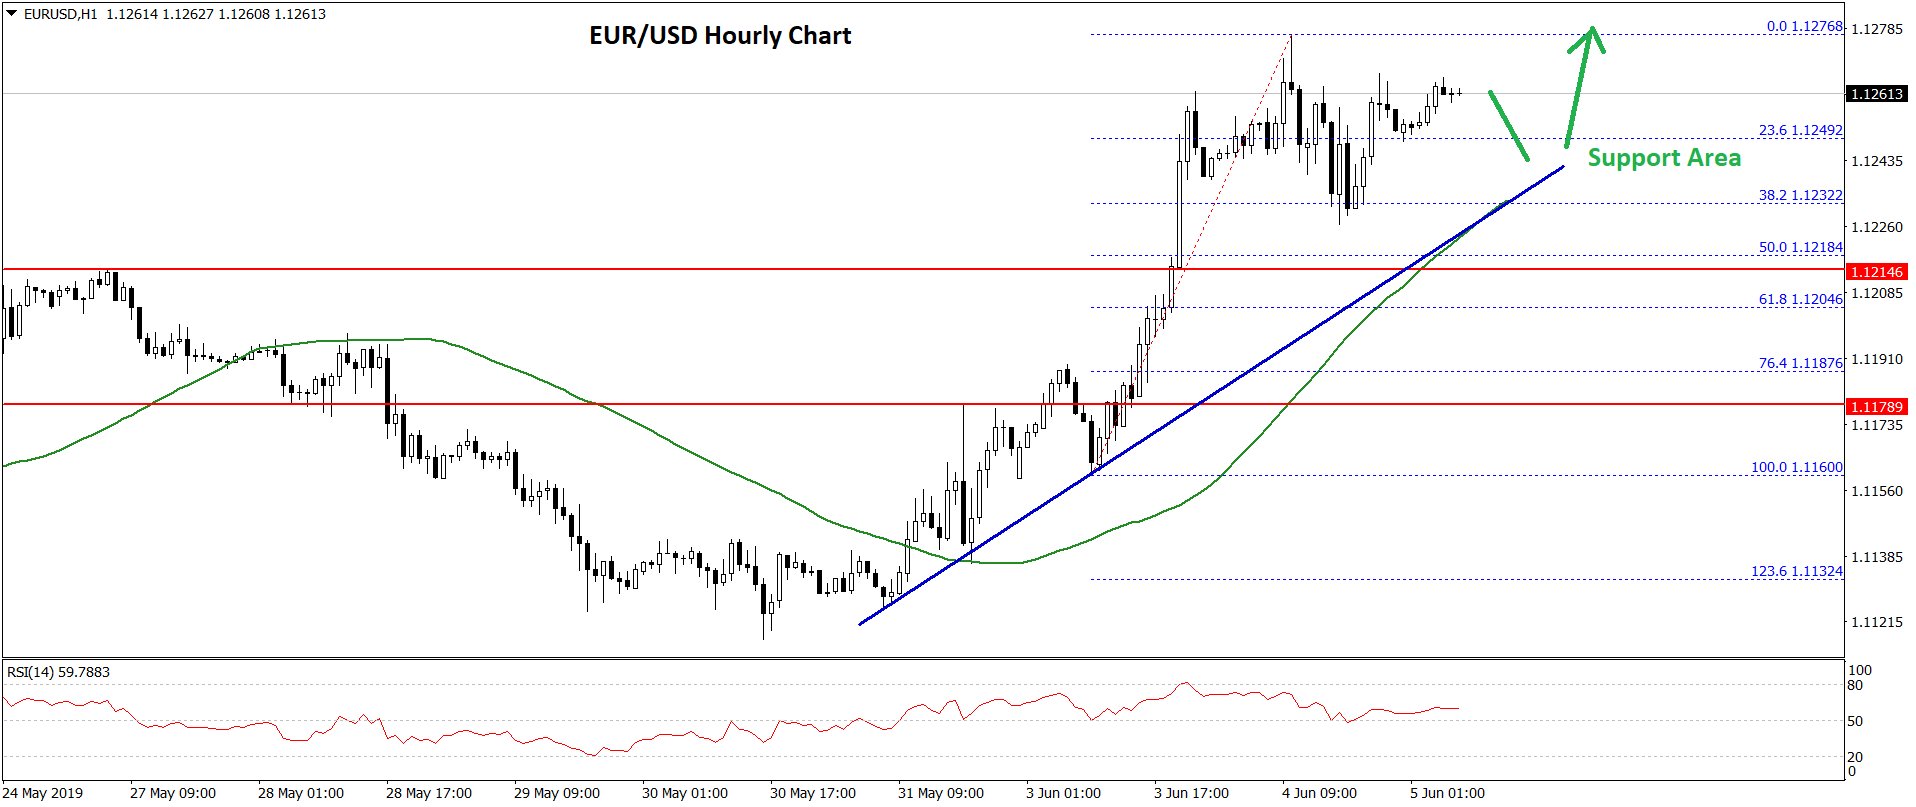
At the moment, the pair is correcting lower and it recently traded below the 1.1250 level. There was a break below the 23.6% Fib retracement level of the recent wave from the 1.1160 low to 1.1276 high.
However, declines were limited and the pair found support near the 1.1230 level. The 38.2% Fib retracement level of the recent wave from the 1.1160 low to 1.1276 high also acted as a decent support.
Moreover, there is a key bullish trend line in place with support near 1.1235 on the hourly chart of EUR/USD. The 50 hourly SMA is also near the trend line and the 1.1230 support.
As long as the pair is above the trend line, there are chances of more gains above the 1.1260 and 1.1270 levels. The next main resistance is near the 1.1300 level.
On the downside, an initial support is near the 1.1235 and 1.1230 levels. If there is a downside break below the 1.1230 support, there are chances of more losses below the 1.1220 and 1.1210 levels.
USD/JPY Technical Analysis
The US Dollar failed to move above the 110.00 resistance and declined heavily against the Japanese Yen. The USD/JPY pair broke the 109.50 and 109.00 support levels to move into a bearish zone.
The decline was such that the pair even broke the 108.40 support and the 50 hourly simple moving average. The pair even spiked below the 108.00 level and traded as low as 107.84.
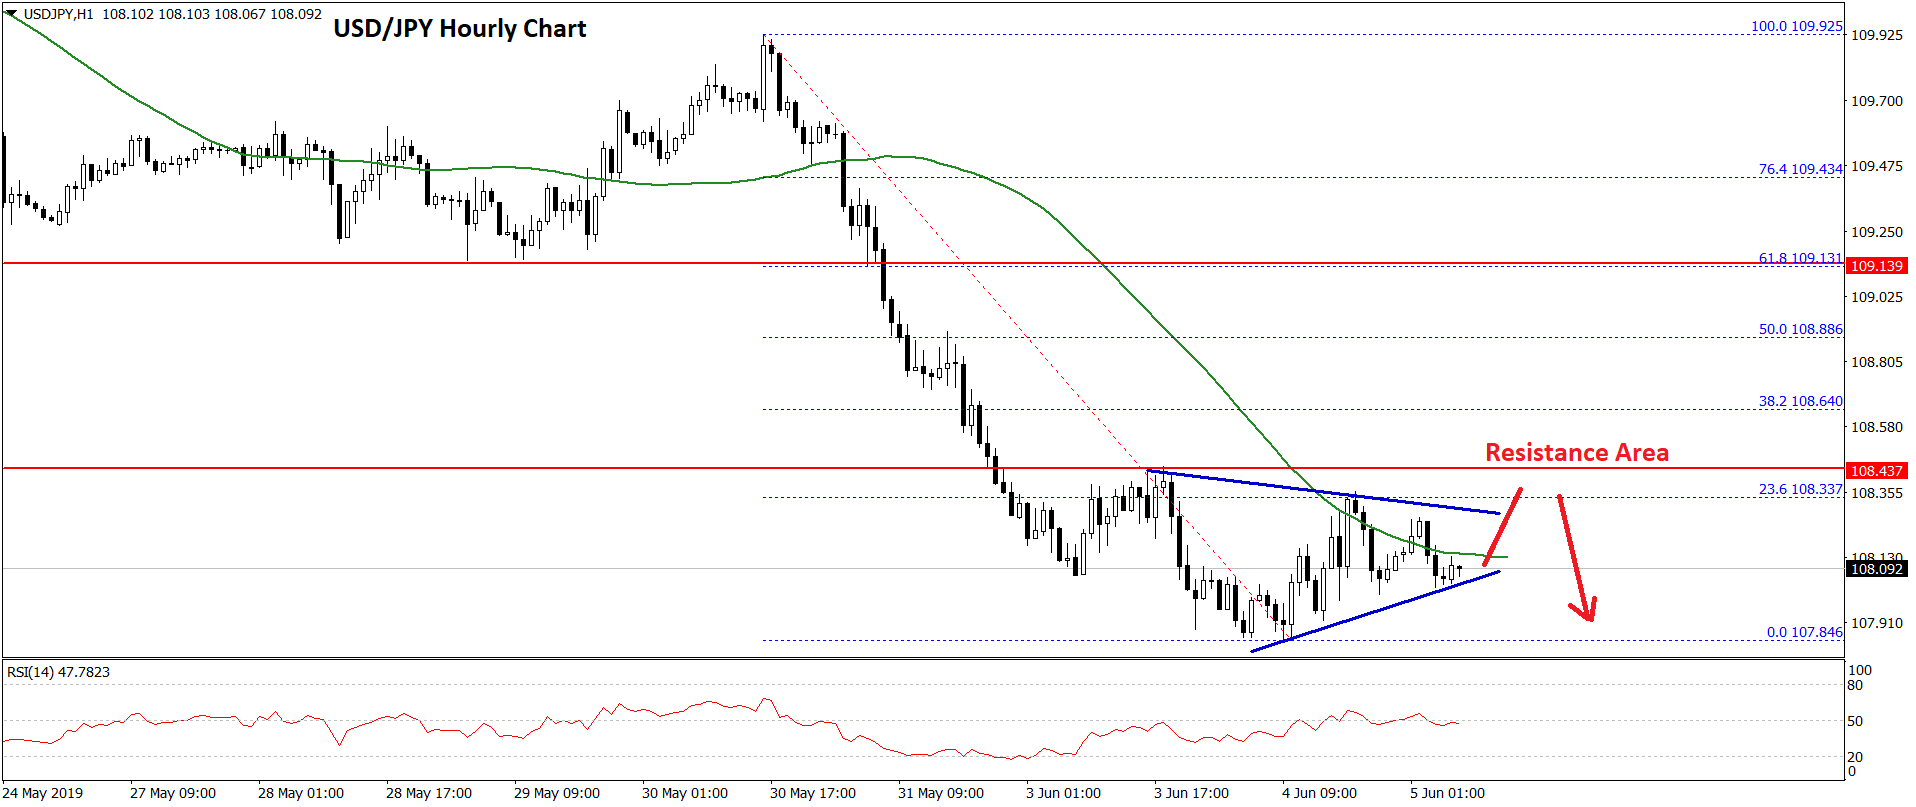
At the moment, it is consolidating losses above the 108.00 level. It traded above the 23.6% Fib retracement level of the recent decline from the 109.92 high to 107.84 low. There is also a short term breakout pattern forming with resistance near 108.30 on the hourly chart.
If there is an upside break above the 108.40 level, there are chances of more upsides towards the 108.80 and 109.00 levels. The next key resistance is near the 109.20 level.
Conversely, if there is a downside break, the USD/JPY pair could accelerate losses below the 108.00 level. An initial support is near the 107.80 level, below which there is a risk of a sharp decline towards the 107.50 level.
If sellers remain in action, the pair might even test the 107.20 support area in the near term.
Trade over 50 forex markets 24 hours a day with FXOpen. Take advantage of low commissions, deep liquidity, and spreads from 0.0 pips. Open your FXOpen account now or learn more about trading forex with FXOpen.
This article represents the opinion of the Companies operating under the FXOpen brand only. It is not to be construed as an offer, solicitation, or recommendation with respect to products and services provided by the Companies operating under the FXOpen brand, nor is it to be considered financial advice.
Latest from Forex Analysis
Latest articles

Google Share Price Rose Post-market to a New All-time Record
Yesterday, after the close of the main trading session, a report on activities for the 1st quarter of Alphabet Inc. (Google's parent company) was published. The report was strong, exceeding investors' expectations.
→ Quarterly EPS = USD 1.89 (expected = USD 1.

S&P 500 Rebounds after Negative GDP News
Data released yesterday showed US GDP growth slowed to 1.6% in the first quarter of the year. According to ForexFactory: forecast = 2.2%, past value = 2.4%.
Reaction to the news sent the S&P 500 mini stock

GBP/USD And USD/CAD Daily Chart Outlook
GBP/USD is attempting a recovery wave from 1.2300. USD/CAD is consolidating and might aim for a move above the 1.3760 resistance zone.
Important Takeaways for GBP/USD and USD/CAD Analysis Today
· The British Pound started