


FXOpen
EUR/USD declined heavily and broke the 1.1240 support area before finding buyers near 1.1180. USD/CHF remained in a positive zone and dips remain supported near 0.9965.
Important Takeaways for EUR/USD and USD/CHF
- The Euro faced a solid rise in selling pressure below the 1.1320 support against the US Dollar.
- There is a major declining channel in place with resistance near 1.1230 on the hourly chart of EUR/USD.
- USD/CHF climbed higher recently above the 0.9950 and 0.9980 resistance levels.
- There is a major bullish trend line formed with support at 0.9960 on the hourly chart.
EUR/USD Technical Analysis
The Euro started a significant downside move from well above the 1.1350 level against the US Dollar. The EUR/USD pair broke the 1.1320 and 1.1240 support levels to enter a major downtrend.
The decline was such that the pair even broke the 1.1220 support area and settled below the 50 hourly simple moving average. The pair traded as low as 1.1183 on FXOpen and it is currently correcting higher.
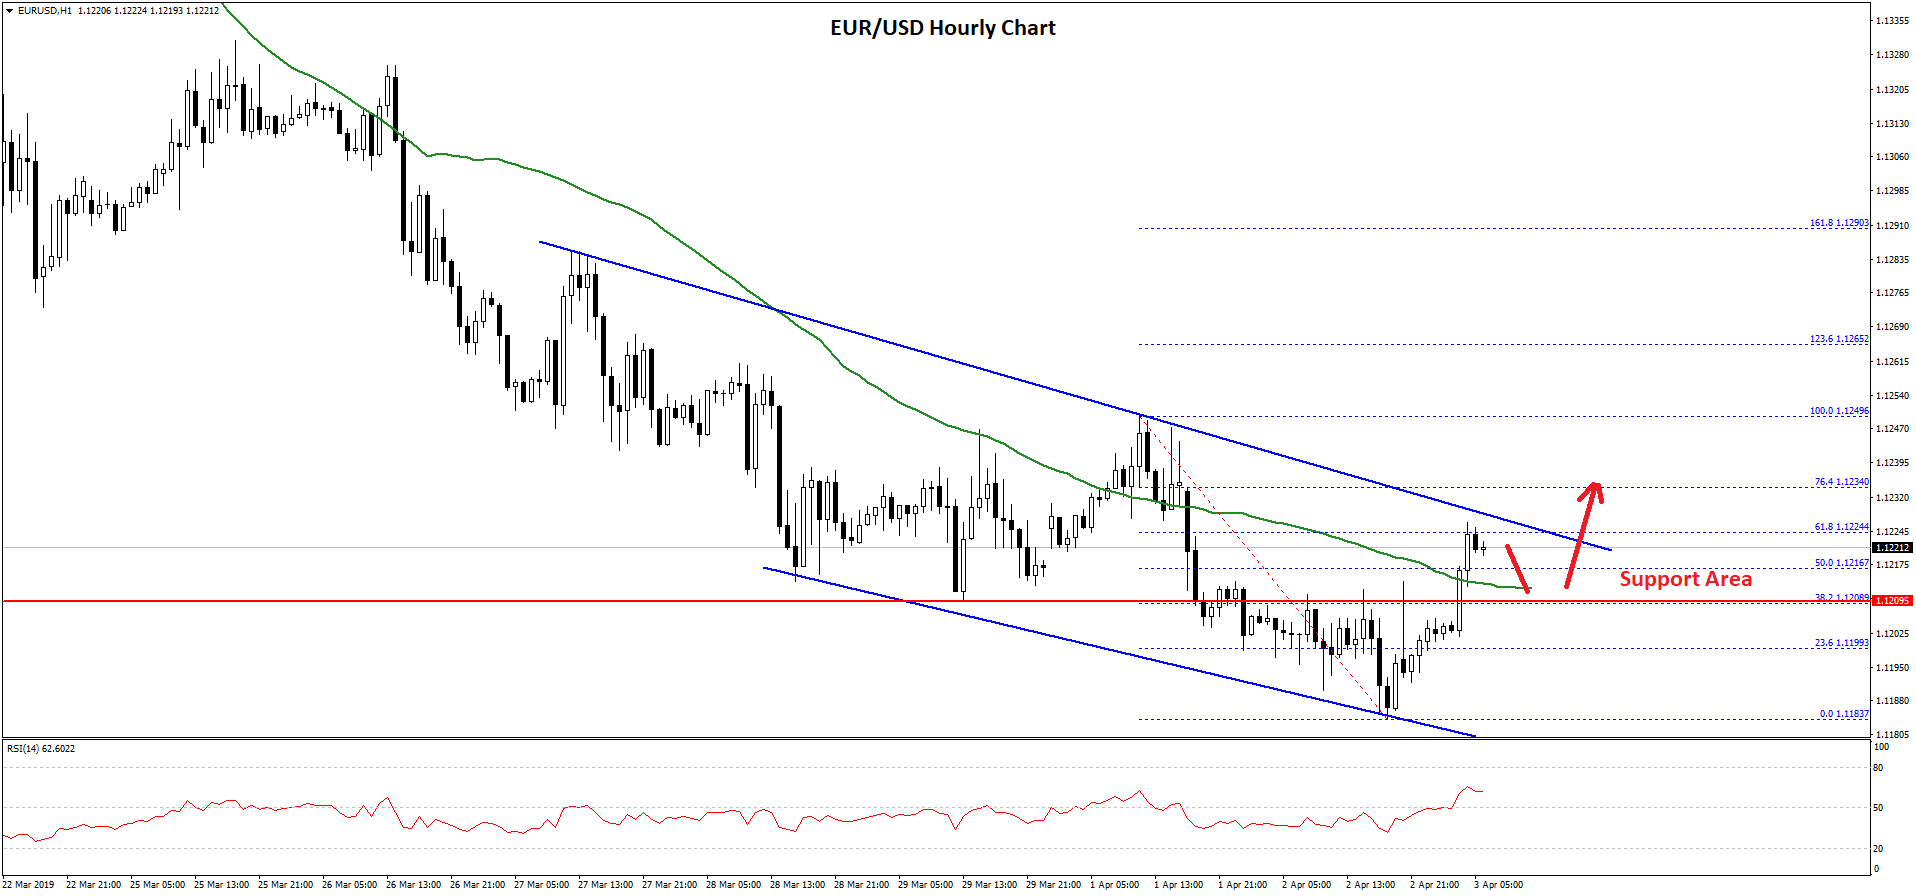
Buyers managed to push the price above the 50% Fib retracement level of the recent decline from the 1.1249 high to 1.1183 low. Moreover, there was a break above the 1.1210 resistance level and the 50 hourly simple moving average.
It is currently trading near the 61.8% Fib retracement level of the recent decline from the 1.1249 high to 1.1183 low. There is also a major declining channel in place with resistance near 1.1230 on the hourly chart of EUR/USD.
A break above the channel resistance near the 1.1225 and 1.1230 resistance levels may call for more upsides in the near term. On the upside, the next major resistance is near the 1.1250 level.
On the downside, there is a decent support formed near the 1.1200-1.1210 zone. If there is a close below 1.1200, the pair might move back towards the 1.1180 and 1.1160 levels.
USD/CHF Technical Analysis
The US Dollar started a solid upward move from the 0.9900-0.9910 support area against the Swiss franc. The USD/CHF pair traded above the 0.9940 and 0.9950 resistance levels to move into a positive zone.
Buyers gained control and pushed the pair above the 0.9980 resistance and the 50 hourly simple moving average. The pair traded close the 1.0000 resistance and formed a high at 0.9999. Later, there was a downside correction below the 0.9985 support.
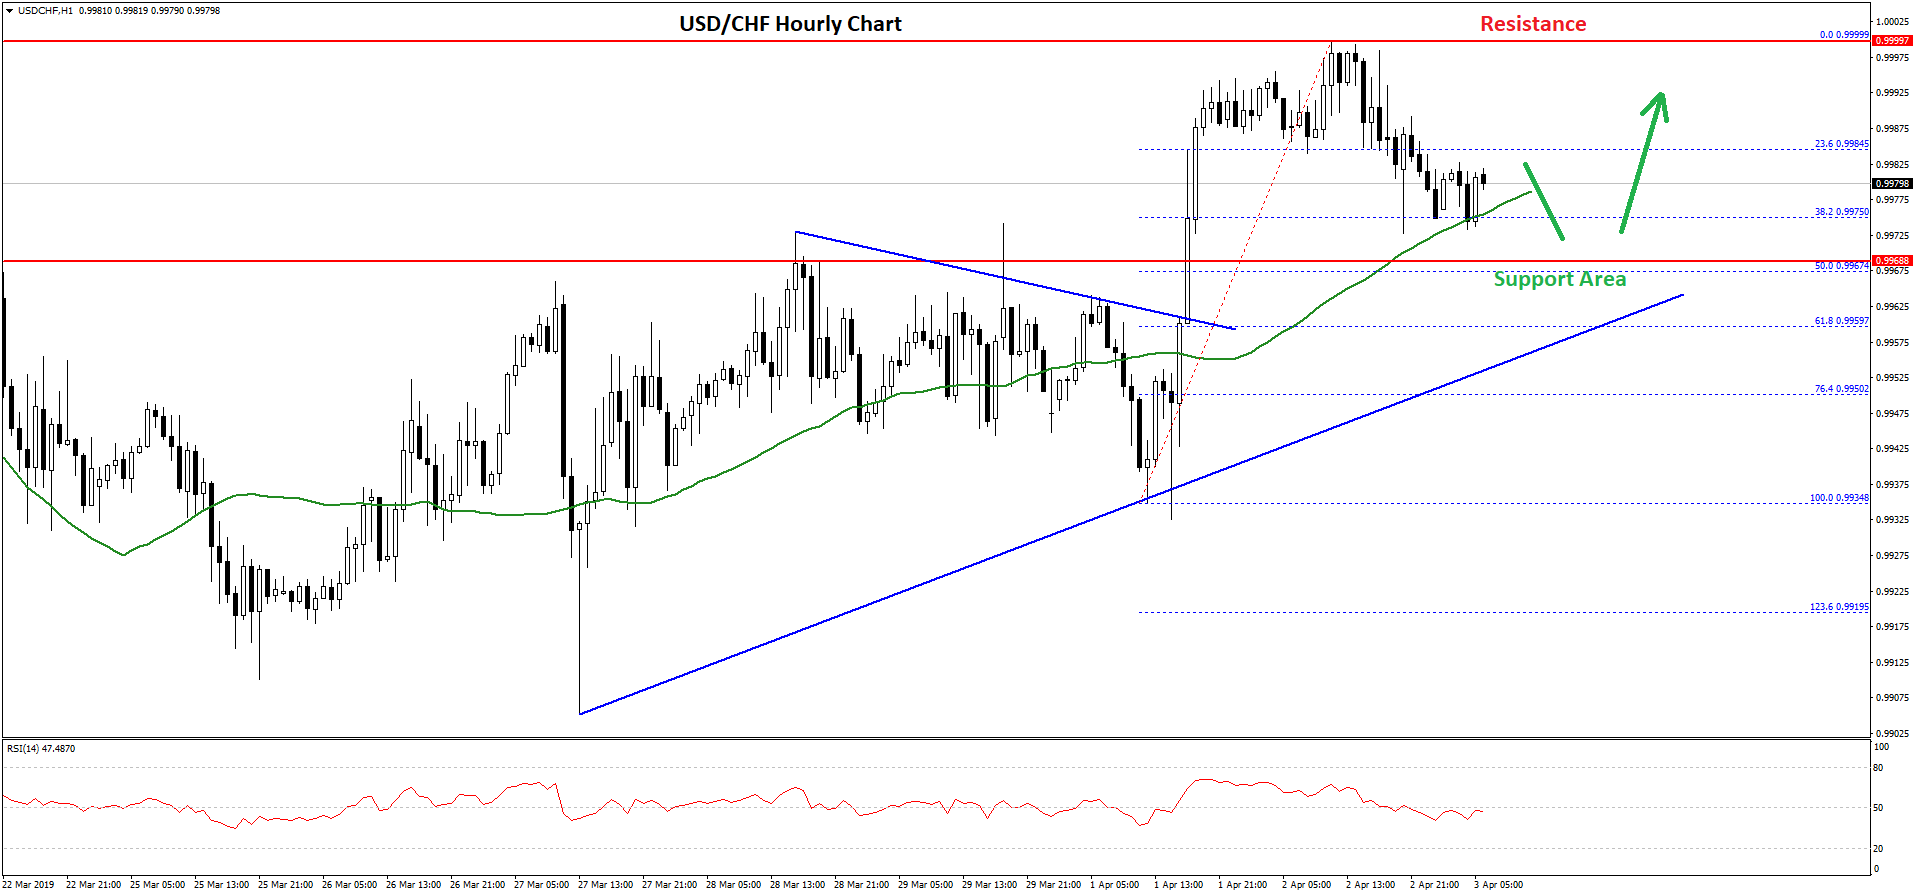
The pair broke the 23.6% Fib retracement level of the recent wave from the 0.9934 low to 0.9999 high. However, the 0.9875 support and the 50 hourly simple moving average is currently acting as a support.
The next key support is near the 0.9965 level. It coincides with the previous resistance zone and the 50% Fib retracement level of the recent wave from the 0.9934 low to 0.9999 high.
Therefore, if the pair corrects further, it is likely to find a strong buying interest near the 0.9965 support area in the coming sessions. Below 0.9965, the next key support is near the 0.9940 level.
On the upside, the main resistance is near the 1.0000 area, where sellers are likely to take a stand. An upside break above 1.0000 might call for more gains towards the 1.0025 and 1.0050 levels.
Trade over 50 forex markets 24 hours a day with FXOpen. Take advantage of low commissions, deep liquidity, and spreads from 0.0 pips. Open your FXOpen account now or learn more about trading forex with FXOpen.
This article represents the opinion of the Companies operating under the FXOpen brand only. It is not to be construed as an offer, solicitation, or recommendation with respect to products and services provided by the Companies operating under the FXOpen brand, nor is it to be considered financial advice.
Latest from Forex Analysis
Latest articles

Anchored VWAP and How You Can Use It in Forex Trading
In the world of forex trading, understanding the nuanced tools at your disposal can significantly enhance decision-making processes. One such sophisticated tool is the Anchored Volume-Weighted Average Price (Anchored VWAP), which refines the standard VWAP by allowing traders to set

META Share Price Collapses after Publication of Quarterly Report
Just yesterday, META's stock price closed at USD 493.50, up approximately 40% since the start of 2024 and up nearly 300% since the start of 2023.
However, following the release of Meta's quarterly report, its shares plummeted to USD

USD/JPY Analysis: The Rate Exceeds The Level of 155 Yen Per US Dollar
Today, the price of USD/JPY once again renewed its 34-year high, exceeding the level of 155 yen per dollar, which put pressure on the current authorities.
According to Reuters, officials are trying to maintain calm in the market.
"We