


FXOpen
EUR/USD failed to stay above the 1.1260 level and recently declined below 1.1220. USD/CHF declined heavily towards 1.0050 and it is currently correcting towards key resistances.
Important Takeaways for EUR/USD and USD/CHF
- The Euro topped near the 1.1263 level and declined recently below 1.1220 against the US Dollar.
- There was a break below a connecting bullish trend line with support at 1.1228 on the hourly chart of EUR/USD.
- USD/CHF declined heavily in the past few days and traded close to the 1.0050 level.
- Recently, it recovered above a major bearish trend line with resistance near 1.0070 on the hourly chart.
EUR/USD Technical Analysis
The Euro formed a decent support near the 1.1170 and 1.1175 levels against the US Dollar. The EUR/USD pair traded higher above the 1.1240 level, but it struggled to hold gains above the 1.1260 level.
A swing high was formed at 1.1263 on FXOpen and the pair recently started a downside correction. It broke the 1.1240 and 1.1220 levels to enter a bearish zone.
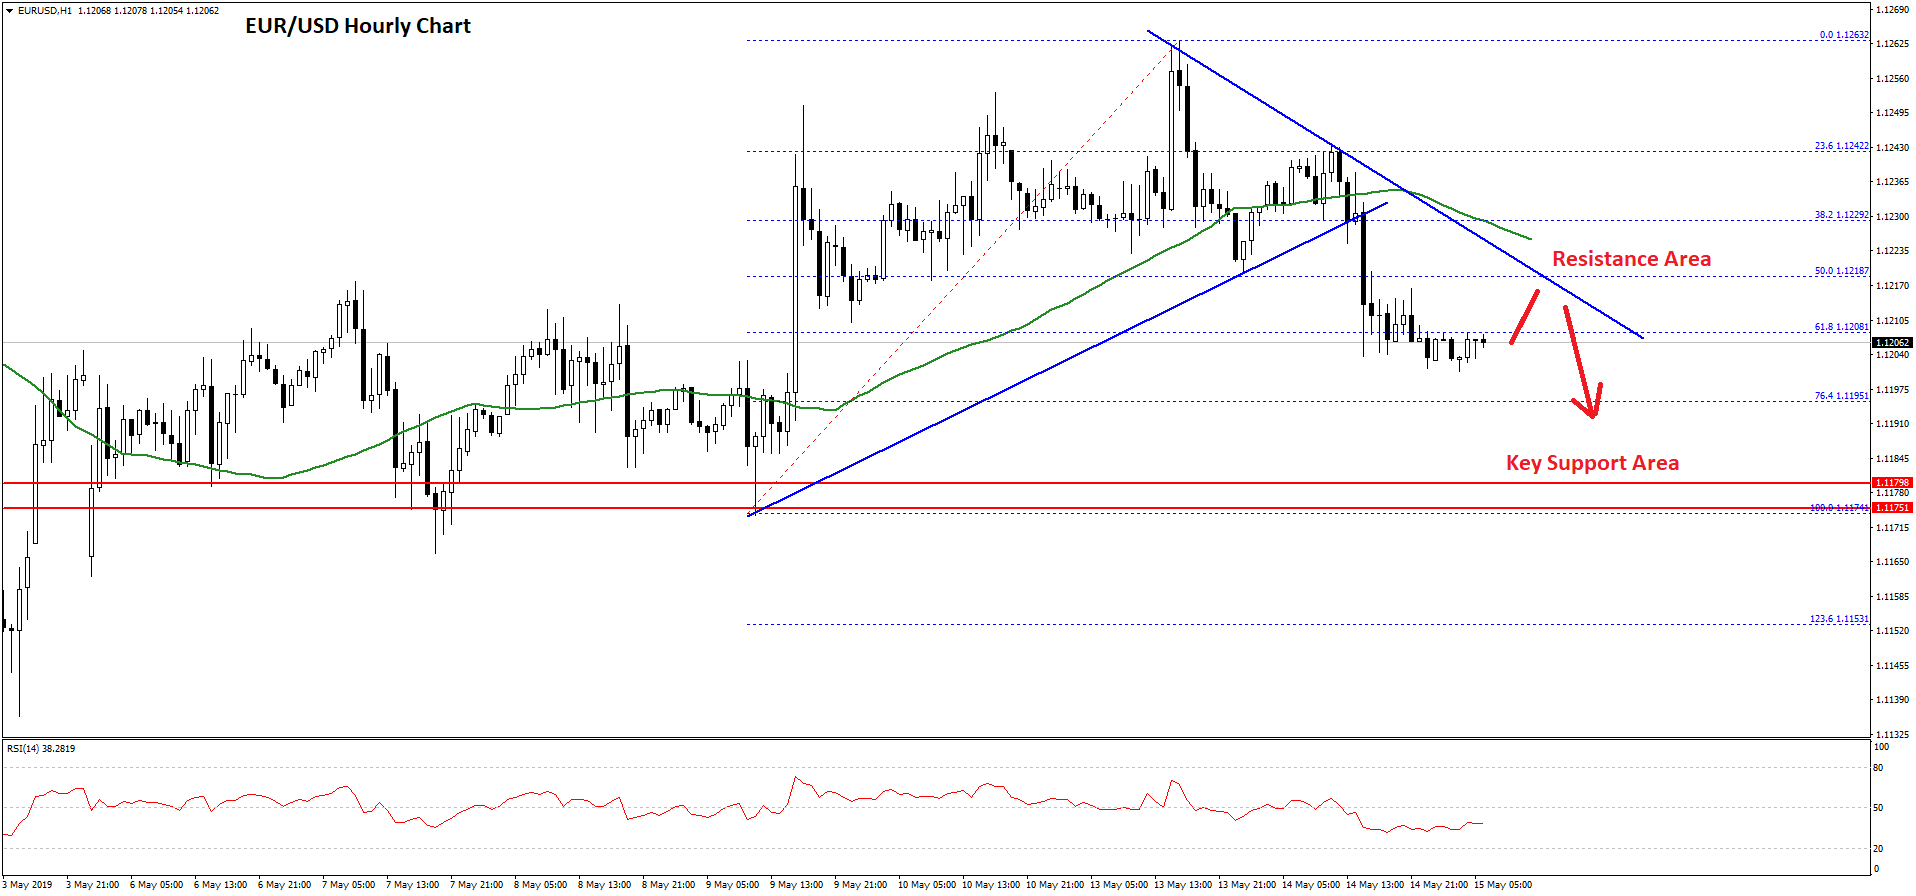
There was also a break below a connecting bullish trend line with support at 1.1228 on the hourly chart. Besides, the pair settled below the 1.1220 level and the 50 hourly simple moving average. It cleared the 50% Fib retracement level of the last wave from the 1.1174 low to 1.1263 high.
The pair is currently under pressure and it seems like it could continue to move down in the near term. An immediate support is near the 1.1195 level, plus the 76.4% Fib retracement level of the last wave from the 1.1174 low to 1.1263 high.
If there is a break below the 1.1195 support, the pair is likely to test the main 1.1175 support area. On the upside, there is a connecting bearish trend line forming with resistance at 1.1225.
To start a fresh increase, EUR/USD must break the 1.1225 resistance level and settle above the 50 hourly simple moving average. If it fails to recover above 1.1225, there is a risk of an extended decline below 1.1175.
USD/CHF Technical Analysis
The US Dollar started a significant downward move from well above the 1.0200 level against the Swiss franc. The USD/CHF pair broke the main 1.0150 support level to enter a bearish zone.
During the recent decline, the pair even broke the 1.0100 support and the 50 hourly simple moving average. It traded close to the 1.0050 level and recently started an upside correction.
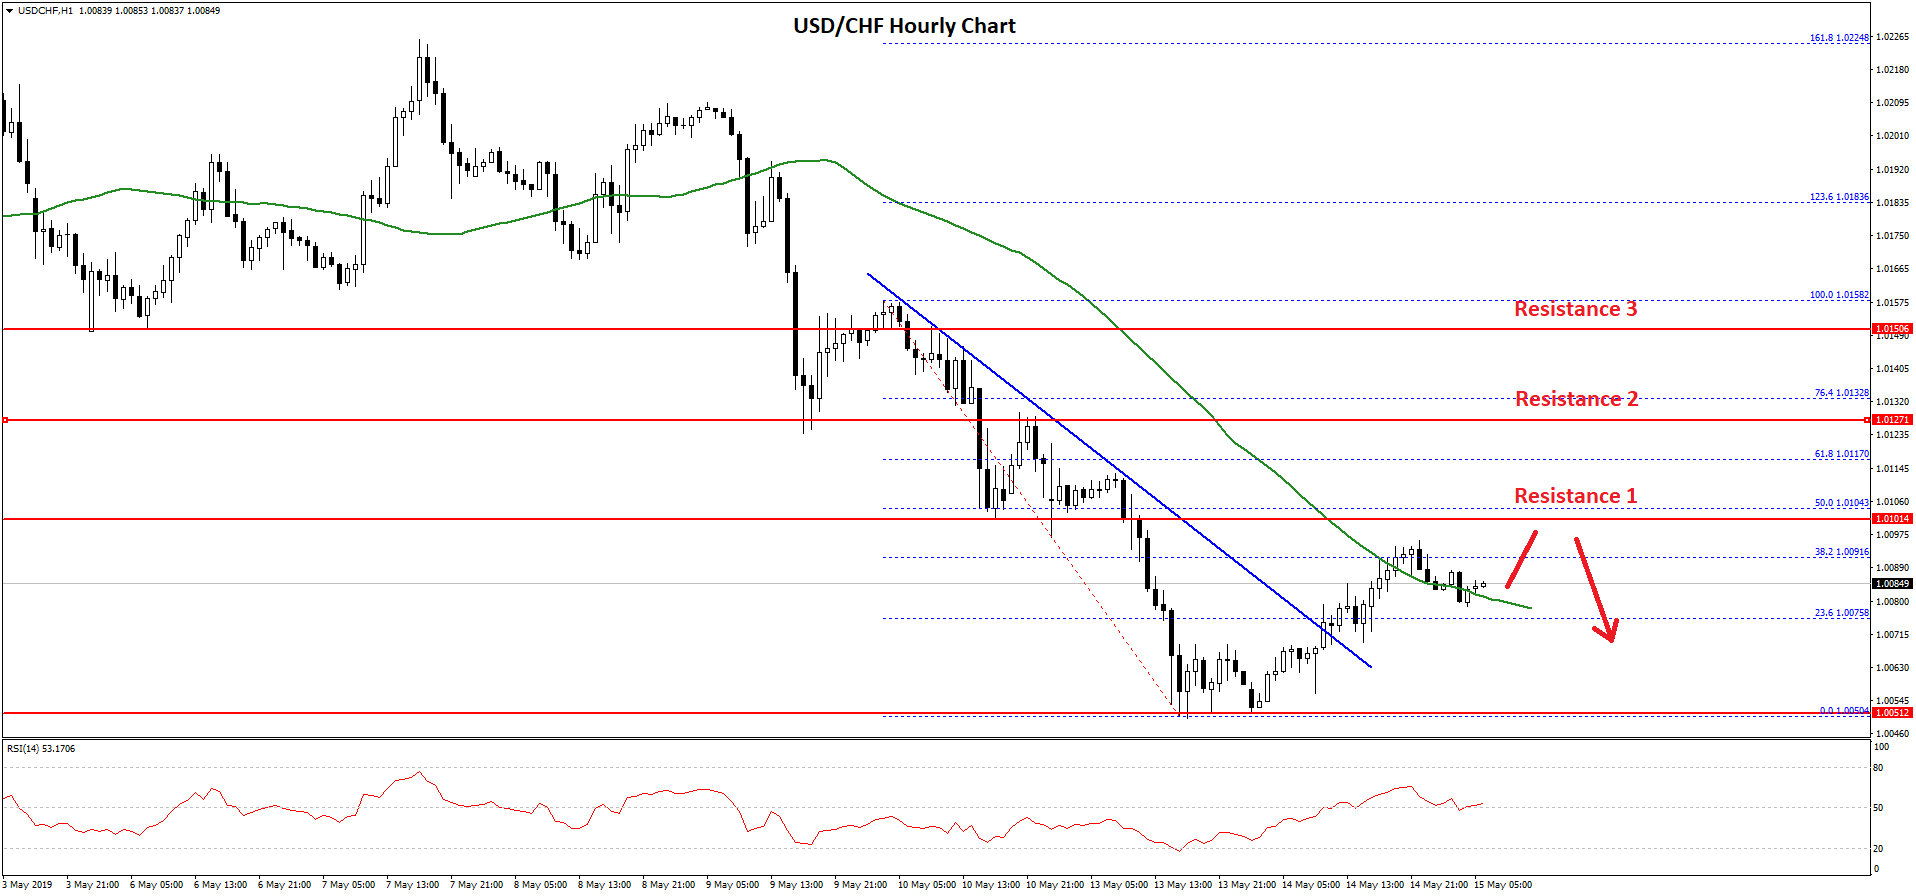
It recovered above a major bearish trend line with resistance near 1.0070 on the hourly chart. It recently tested the 38.2% Fib retracement level of the latest drop from the 1.0158 high to 1.0050 low.
On the upside, there are many resistances near the 1.0100 and 1.0110 levels. The 50% Fib retracement level of the latest drop from the 1.0158 high to 1.0050 low is also near the 1.0104 level to act as a strong resistance.
Above 1.0110, the pair could test the 1.0120 level. However, a strong upward move above 1.0100 won’t be easy. If USD/CHF fails to climb above the 1.0100 level, there is a risk of another push below the 1.0070 level.
The next key support for USD/CHF is near the 1.0050 level, below which the pair could test 1.0020 in the near term.
Trade over 50 forex markets 24 hours a day with FXOpen. Take advantage of low commissions, deep liquidity, and spreads from 0.0 pips. Open your FXOpen account now or learn more about trading forex with FXOpen.
This article represents the opinion of the Companies operating under the FXOpen brand only. It is not to be construed as an offer, solicitation, or recommendation with respect to products and services provided by the Companies operating under the FXOpen brand, nor is it to be considered financial advice.
Latest from Forex Analysis
Latest articles

What Is a Darvas Box Theory and How Does It Work in Trading?
The Darvas Box Theory, pioneered by Nicolas Darvas in the 1950s, has transcended its stock market origins to become a valuable tool for forex traders. This method leverages specific price movements and patterns, known as the Darvas Box, to track

NFLX Stock Price Falls Despite Subscriber Growth
Yesterday, after the close of the main trading session on the stock market, Netflix reported to investors for the 1st quarter of 2024.
The report turned out better than expected:
→ earnings per share: actual = USD 5.28, forecast = USD 4.

Escalation Between Iran and Israel: How the Price of Brent Oil Reacts
On the night of Thursday into Friday, reports emerged that Israel had attacked Iran following Iran's attack on Israel over the weekend.
Let's remember that we wrote on Monday that after a 300 drone and missile attack on Israel over