


FXOpen
EUR/USD declined recently and broke the 1.1500 support area. USD/CHF seems to be forming a major top near the 0.9980 resistance area.
Important Takeaways for EUR/USD and USD/CHF
- The Euro declined sharply and traded towards the 1.1440 support area against the US Dollar.
- There is a major bearish trend line in place with resistance at 1.1515 on the hourly chart of EUR/USD.
- USD/CHF struggled to break the 0.9980 resistance area and declined recently.
- There is a breakout pattern forming with support near 0.9942 on the hourly chart.
EUR/USD Technical Analysis
The Euro started a major downside move from the 1.1580 and 1.1550 resistance levels against the US Dollar. The EUR/USD pair declined sharply and settled below the 1.1500 support area.
The decline was such that the pair traded below the 1.1460 level and the 50 hourly simple moving average. A low was formed near the 1.1440 level and later the pair started a short term recovery.
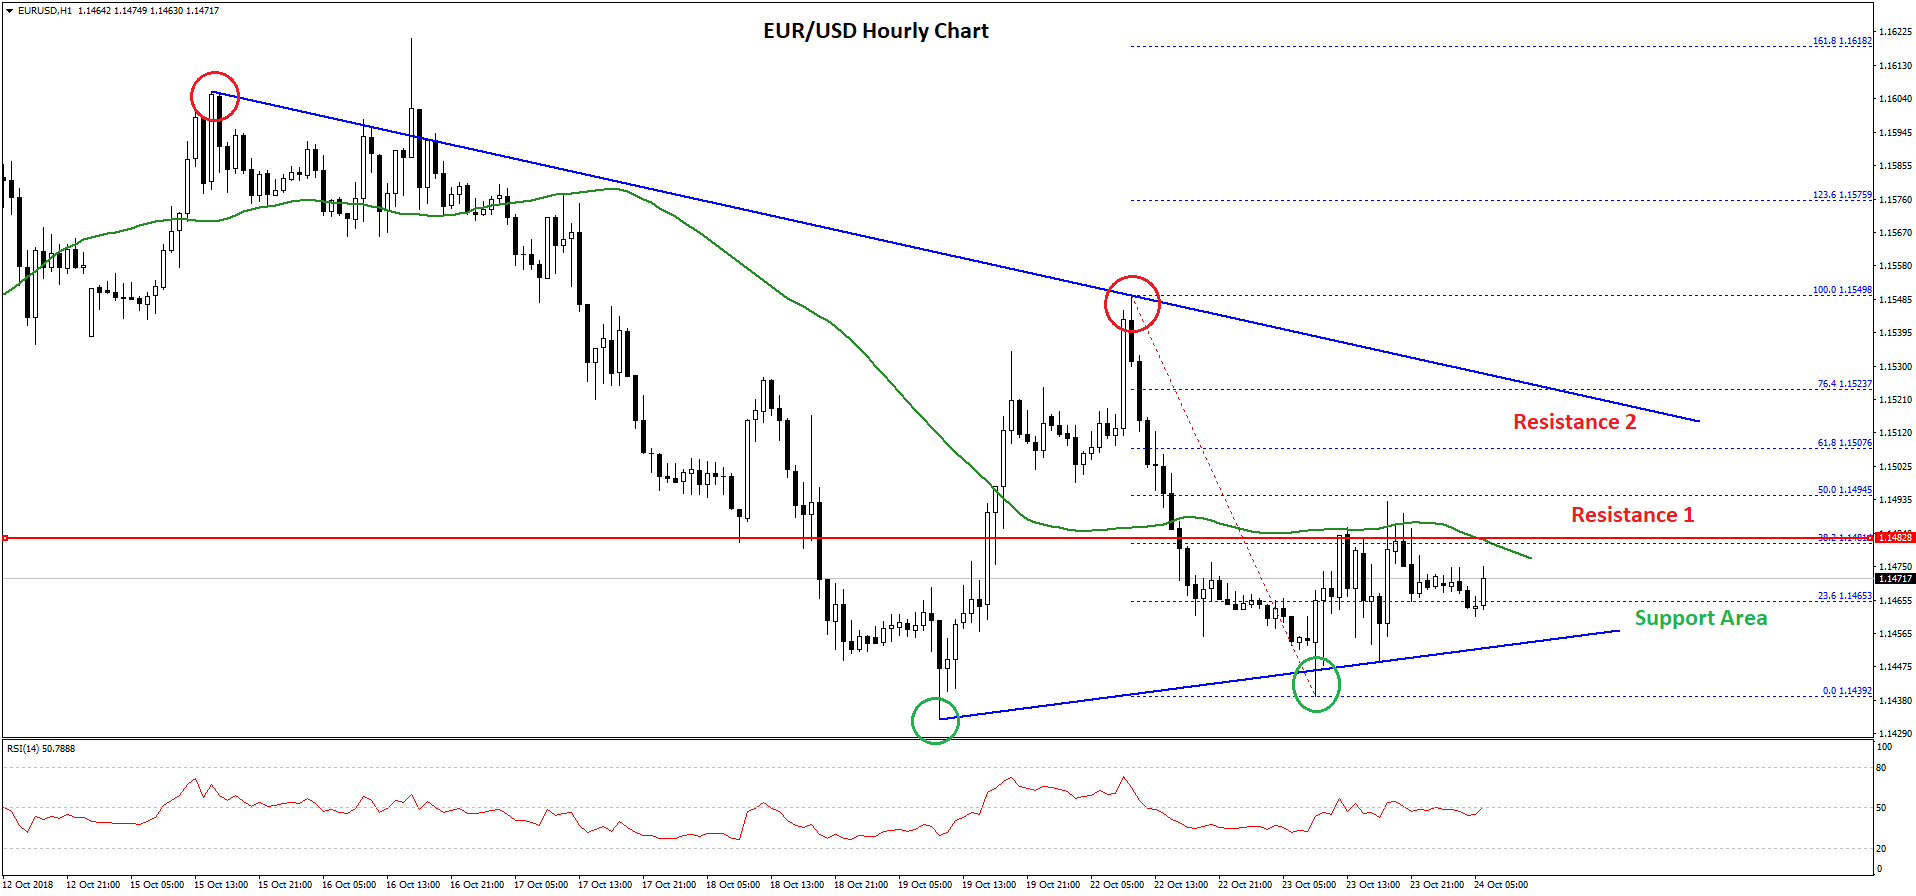
The pair moved above the 23.6% Fib retracement level of the last decline from the 1.1550 high to 1.1439 low. However, the pair is currently struggling to move above the 1.1480 resistance and the 50 hourly SMA.
Above 1.1480, the next resistance is near 1.1500 and the 50% Fib retracement level of the last decline from the 1.1550 high to 1.1439 low. Moreover, there is a major bearish trend line in place with resistance at 1.1515 on the hourly chart of EUR/USD.
Therefore, if the pair continues to move higher, it is likely to find a strong resistance near the 1.1500 and 1.1515 levels. On the downside, the 1.1440 level is a decent support. If there a break below 1.1440, EUR/USD could decline further towards the 1.1400 area in the near term.
Overall, sellers are likely to take a stand near 1.1500 if the price manages to rise above 1.1480.
USD/CHF Technical Analysis
The US Dollar followed a bullish path from the 0.9860 support area against the Swiss franc. The USD/CHF pair surged above the 0.9900 and 0.9940 resistance levels to move into a positive zone.
However, the pair faced a strong resistance near the 0.9980 zone. There were many attempts to break the 0.9980 resistance, but buyers failed to gain momentum. The pair moved down and broke the 0.9960 support and the 50 hourly simple moving average.
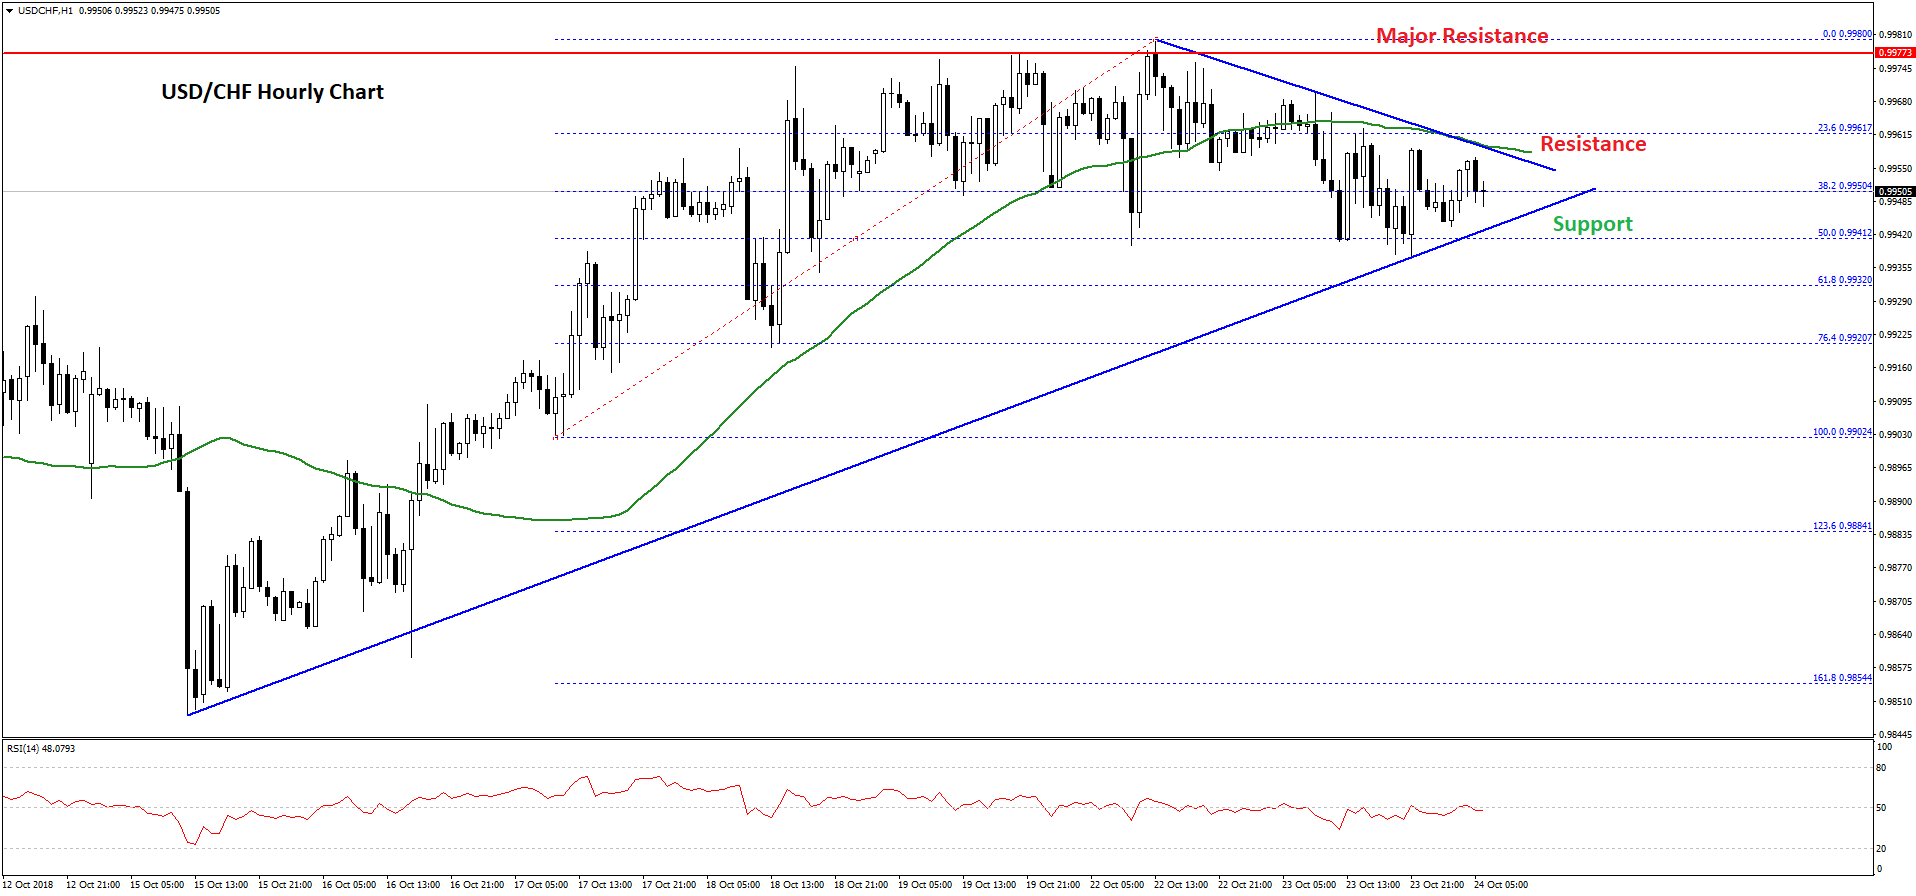
The decline was such that the pair tested the 0.9940 support and the 50% Fib retracement level of the last wave from the 0.9902 low to 0.9980 high.
At the outset, it seems like there is a breakout pattern forming with support near 0.9942 on the hourly chart. If there is a break above 0.9955, the pair could retest the 0.9980 resistance. Finally, the most important resistance is near the 1.0000 level.
On the downside, the main support is at 0.9940-42, below which the pair could move into a bearish zone. The next immediate support is the 76.4% Fib retracement level of the last wave from the 0.9902 low to 0.9980 high at 0.9920.
If the pair continues to move down, the next stop for buyers will most likely be near the 0.9900 support. Overall, the USD/CHF pair is currently preparing for the next break either above the 0.9955 resistance or below the 0.9940 support.
Trade over 50 forex markets 24 hours a day with FXOpen. Take advantage of low commissions, deep liquidity, and spreads from 0.0 pips. Open your FXOpen account now or learn more about trading forex with FXOpen.
This article represents the opinion of the Companies operating under the FXOpen brand only. It is not to be construed as an offer, solicitation, or recommendation with respect to products and services provided by the Companies operating under the FXOpen brand, nor is it to be considered financial advice.
Latest from Forex Analysis
Latest articles

Anchored VWAP and How You Can Use It in Forex Trading
In the world of forex trading, understanding the nuanced tools at your disposal can significantly enhance decision-making processes. One such sophisticated tool is the Anchored Volume-Weighted Average Price (Anchored VWAP), which refines the standard VWAP by allowing traders to set

META Share Price Collapses after Publication of Quarterly Report
Just yesterday, META's stock price closed at USD 493.50, up approximately 40% since the start of 2024 and up nearly 300% since the start of 2023.
However, following the release of Meta's quarterly report, its shares plummeted to USD

USD/JPY Analysis: The Rate Exceeds The Level of 155 Yen Per US Dollar
Today, the price of USD/JPY once again renewed its 34-year high, exceeding the level of 155 yen per dollar, which put pressure on the current authorities.
According to Reuters, officials are trying to maintain calm in the market.
"We