


FXOpen

Ether has lost the upward momentum versus BTC. While a new swing high was made today, the coin has made meager gains in the past two weeks.
Ether Loses Momentum
Ether prices have lost the positive momentum vs bitcoin. We are currently quoted at 0.08414 BTC, below the highs hit back on May 6th.
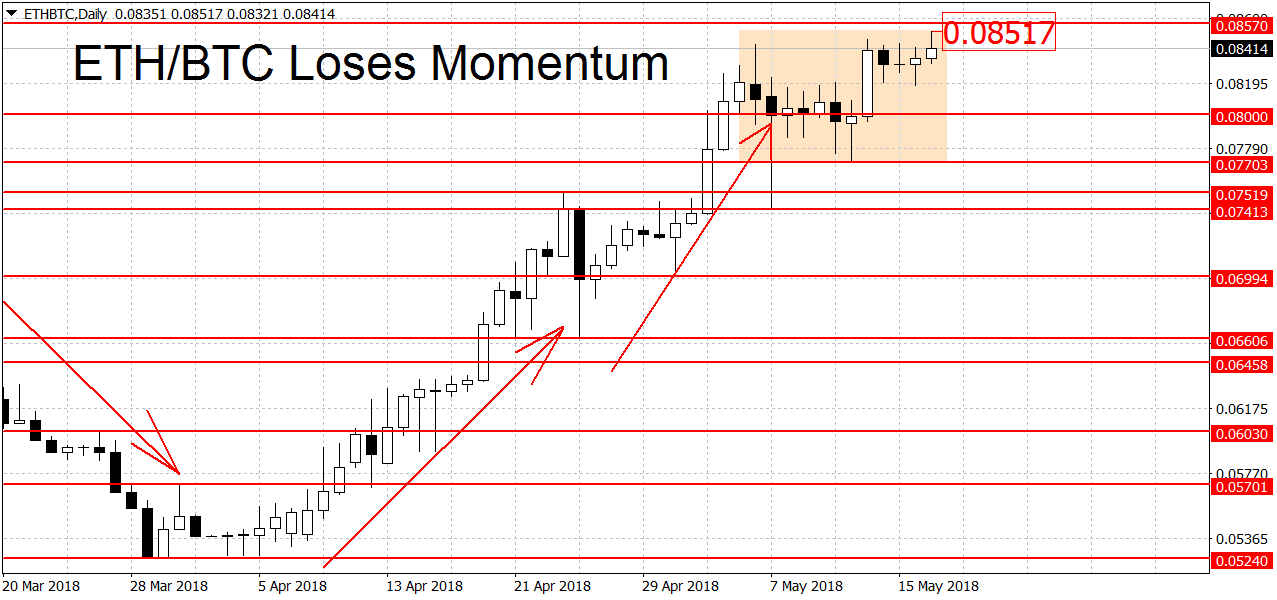
Nonetheless, ETH/BTC remains in an uptrend on the daily charts. To end it the bears will have to make a decisive push below the 0.07703 BTC swing low. A breakdown below 0.07413 BTC is needed for a new downtrend.
Higher up there’s weak resistance above the 0.085 BTC round figure. This is followed by the 0.08829 swing high and the 0.09 and 0.1 BTC round figures. A decisive breakout above here may open to door to this year’s high at 0.121 BTC. On the longer-term weekly charts Ether is range-bound. The trend is bullish on the monthly charts, which take a longer time to turn.
Dash Slightly Higher
Dash is trading slightly higher compared to our last update. We are quoted at 0.04945 BTC at the moment, up by close to 7 percent.
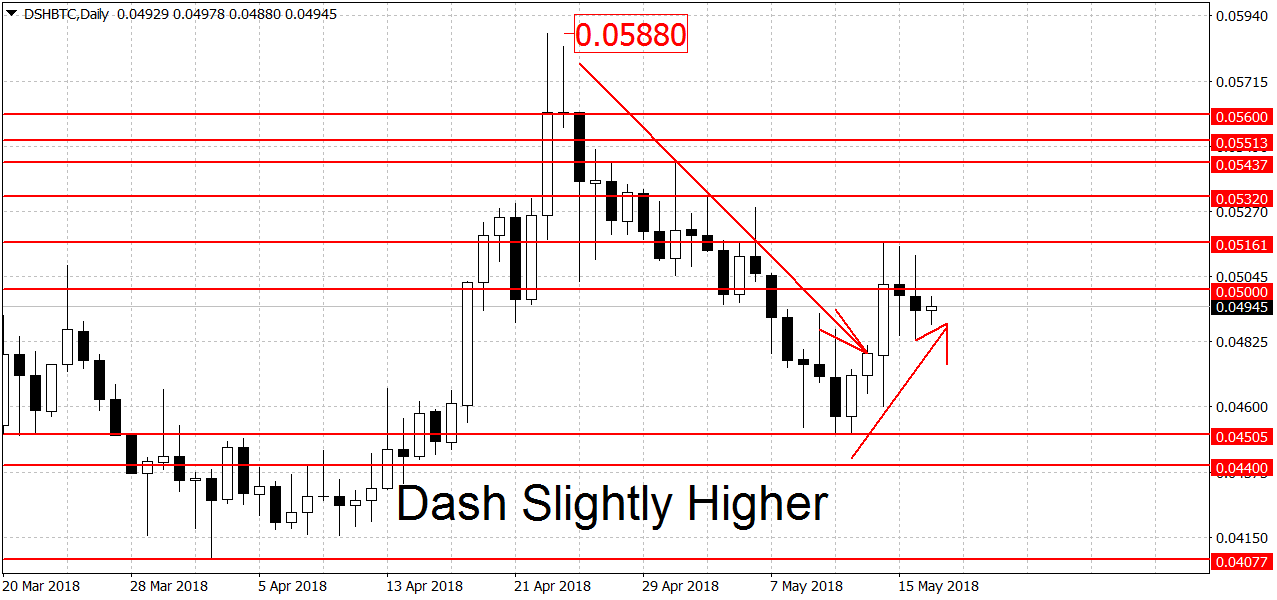
Still, the downward trend on the daily charts is not yet broken. For that we will need a decisive breakout above the new swing high at 0.05161 BTC. A breakout above 0.05437 BTC is needed for a restart of the rally. On the longer-term weekly charts DSH/BTC is also range-bound. The monthly charts are still looking bullish.
Bitcoin Down by 5 Percent
Bitcoin is down by close to 5 percent since our last article two days ago. We are trading at $8,260 dollars right now, compared to $8,683 on Tuesday. The end of the Consensus conference yesterday may lead to some traders closing their speculative longs and thus exacerbating the losses.
For BTC/USD the trend on the daily charts remains down. To end it we need to see a breakout above the $9,500 level. Support below can be found at around the $8,000 round figure. Yesterday we bottomed out close to here at $8,094 dollars. Further down we have the $7,821 dollars swing low. A strong support area below can be found in the $6,420 to $6,600 dollars range. This is where we bottomed out during the last major selloff. A move below could open the door for a break of the year’s low at $5,980 dollars.
The bulls need to take us beyond $10,000 in order to trigger a new BTC rally. The situation for bitcoin on the longer-term charts is the same as the other two coins we covered today, range on the weekly and bullish on the monthly chart.
FXOpen offers the world's most popular cryptocurrency CFDs*, including Bitcoin and Ethereum. Floating spreads, 1:2 leverage — at your service. Open your trading account now or learn more about crypto CFD trading with FXOpen.
*At FXOpen UK and FXOpen AU, Cryptocurrency CFDs are only available for trading by those clients categorised as Professional clients under FCA Rules and Professional clients under ASIC Rules respectively. They are not available for trading by Retail clients.
This article represents the opinion of the Companies operating under the FXOpen brand only. It is not to be construed as an offer, solicitation, or recommendation with respect to products and services provided by the Companies operating under the FXOpen brand, nor is it to be considered financial advice.
Latest articles

Germany's DAX 40 Index Flying High Despite Pessimistic National Outlook
For a number of years now, there has been a lot of discourse over the current situation and the future of the German domestic economy.
From both inside Germany and globally, analysts, government officials, and corporate leaders have demonstrated a

Volatility in the Pound Is Rising, the Euro is Consolidating
GBP/USD
At the end of last week, the British currency fell sharply, testing a significant support level at 1.2300. The resumption of the downward trend for the pair became possible after some statements by British officials:
- On Wednesday,

The Price of Gold XAU/USD Shows Strongest Fall in Almost 2 Years
On Monday, the price of gold fell from USD 2,386 to USD 2,333 per ounce — this is the strongest drop in one day in almost 2 years, according to Bloomberg. On Tuesday morning in the Asian session, the