


FXOpen
Cryptocurrencies can’t get ahead in this environment. Bitcoin is trading range-bound with small daily movements and the altcoin market seems to following along. Ether lost the post-conference momentum and Dash is still trading flat.
Ether Loses Momentum
Ether lost the bullish momentum gained during the Devcon2 conference. Prices topped out at 0.024 BTC on September 21 and we’ve been trading lower ever since. We’re currently quoted at 0.02137.
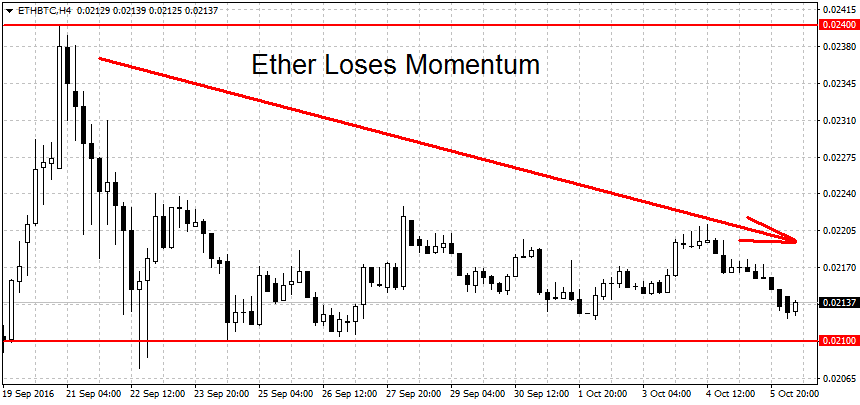
While a tentative uptrend is still in place, a decisive break below the 0.021 level would definitively end it.To resume the upward momentum, ETH/BTC needs to break the September highs at 0.024 BTC. Resistance levels above here can be found at 0.02610 BTC followed by 0.028 and the 0.03 round figure.
A new downtrend requires a break below the 0.01891 swing low. Below we have support levels at the 0.015 round figure followed by 0.0139, 0.0123 and a second round level at 0.01 BTC. The trend on the weekly charts is still in a neutral mode. On the monthly charts there’s not enough data to judge the trend because Ether is a fairly new cryptocurrency.
Dash Still Flat
Dash is trading mostly flat. We’re currently quoted at 0.0197 BTC. This is 2 percent higher compared to the price noted in our previous article, a small amount for 14 days of trading. Looking at the charts below provides an even clearer vision at the lack of trend.
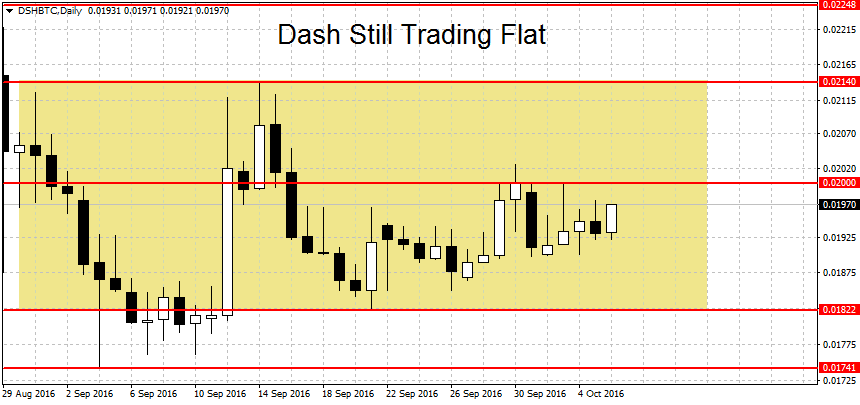
A new uptrend requires a break above the last month’s high at 0.02140. Further up resistance can be found at the 0.02248 swing high followed by 0.02465 and 0.025 BTC. The August high at 0.02668 BTC and the all-time high at 0.028 are also worth having on your charts. Note that on FXOpen prices spiked briefly to a high of 0.031 on August 14 but this move wasn’t replicated elsewhere. Like we’re mentioned in previous articles, it’s a good idea to confirm the moves with prices on other major exchanges. The crypto market is decentralized and is still in its infancy, so large price differences can occur between different exchanges.
A break of the 0.01822 swing low could start a new downtrend for Dash. Below the last month’s low at 0.01741 we have a support at the 0.015 round figure. This level is closely followed by the 0.01389 spike high and the 0.01267 swing high reached in June of this year. The medium-term and long-term DSH/BTC charts are bullish.
FXOpen offers the world's most popular cryptocurrency CFDs*, including Bitcoin and Ethereum. Floating spreads, 1:2 leverage — at your service. Open your trading account now or learn more about crypto CFD trading with FXOpen.
*At FXOpen UK and FXOpen AU, Cryptocurrency CFDs are only available for trading by those clients categorised as Professional clients under FCA Rules and Professional clients under ASIC Rules respectively. They are not available for trading by Retail clients.
This article represents the opinion of the Companies operating under the FXOpen brand only. It is not to be construed as an offer, solicitation, or recommendation with respect to products and services provided by the Companies operating under the FXOpen brand, nor is it to be considered financial advice.
Latest articles

AUD/USD Rises Sharply on Inflation News
The Consumer Price Index for Australia was released this morning. According to ForexFactory:
→ CPI in quarterly terms: actual = 1.0%, expected = 0.8%, previous value = 0.6%;
→ CPI in annual terms: actual = 3.5%, expected = 3.4%, previous value = 3.

TSLA Share Price Up About 13% Despite Disappointing Report
Yesterday, TSLA trading closed at USD 144.68 per share, after which Tesla reported its results for the 1st quarter:
→ earnings per share: actual = USD 0.45, forecast = USD 0.49;
→ gross income: actual = USD 21.45 billion, forecast = USD

Market Analysis: Gold Price Corrects Gains While Oil Price Regains Strength
Gold price rallied above $2,400 before correcting lower. Crude oil price is rising and it could climb further higher toward the $85.50 resistance.
Important Takeaways for Gold and Oil Prices Analysis Today
· Gold price rallied significantly above $2,