


FXOpen

The rally in Dash prices continues to lose steam. We are currently quoted at 0.07439, down from 0.07820 last week. Ether on the other hand remains locked in its range.
Ether Still in a Range
Ether is still trading inside that month-long range. We are currently trading at 0.07158, down by over 10 percent since last Thursday. However as you can see on the chart below, this wasn’t enough enter a bear market. We simply moved from the top of the range toward the middle.
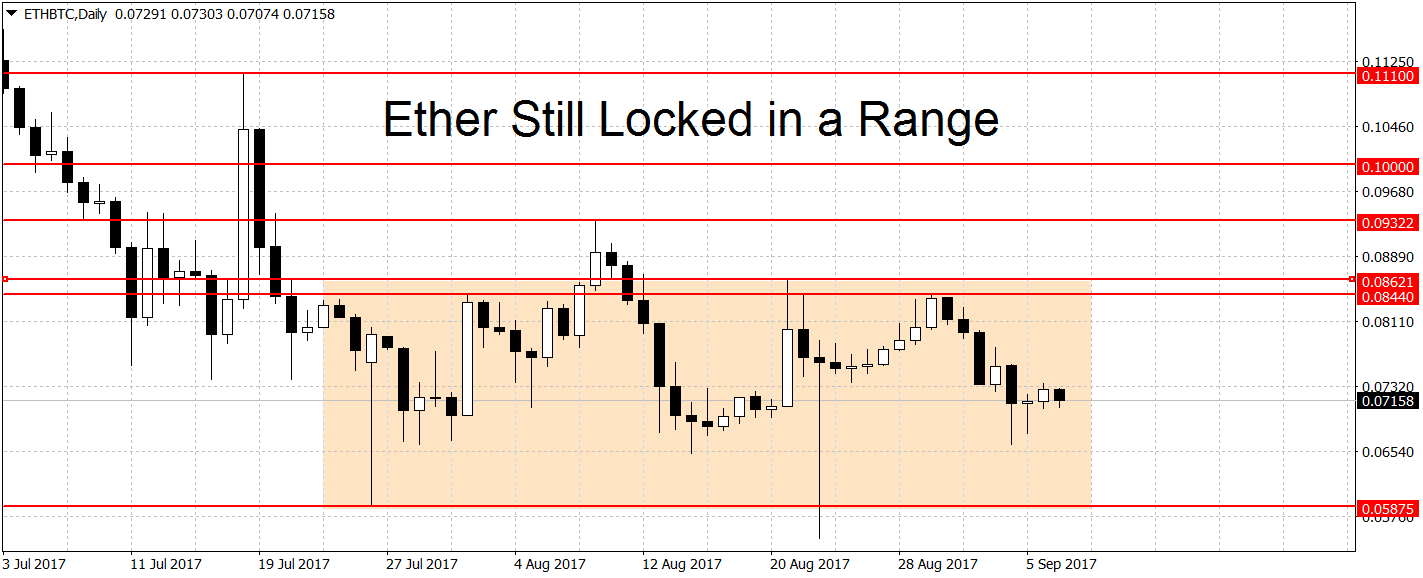
A major upgrade in the ETH network is coming at the end of September. Metropolis will decrease the mining reward but also lower the block time, leading to a slight decrease in the level of inflation. You can read more about the coming Metropolis hard fork HERE. This news event could be just what Ether needs to finally break out of its funk.
A breakout above 0.087 BTC (slightly above the 0.08621 swing high) could start a new ETH rally. Higher up the first notable resistance is at the 0.1 round figure, followed by another important level at 0.111 BTC per coin. A break of this level could lead to more gains.
On the lower end the bears are looking at 0.05875 per BTC. A breakdown below here could start a new downtrend in prices. Our chart above shows a lower low at 0.05495 but this spike low is not present on other charts. On the weekly charts ETH/BTC is range-bound but on the monthlies the pair is still looking bullish.
Dash Rally Loses Steam
The rally in Dash continues to lose steam. We’re now quoted at 0.07439, down from 0.07820 last week. In percentage terms, this is a decline of close to 4.9%.
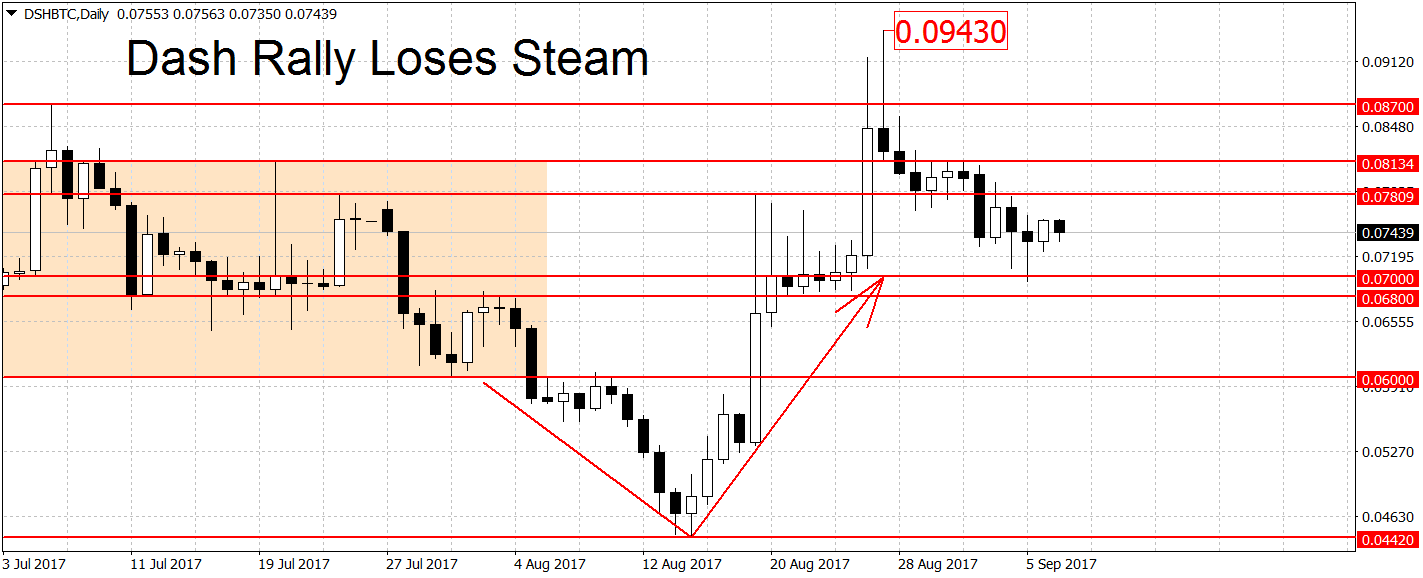
We narrowly avoided a break below the trend-ending level at 0.07. A move below here could terminate the fledgling rally. A new bearish market could commence if we break the 0.054 BTC level. Resistance on the way up can be found at 0.08134, followed by the 0.087 swing high and another swing high at 0.0943 BTC. The 0.1 round figure is another potential resistance level. On the weekly and monthly charts Dash is still bullish.
Bitcoin Back in Range
Bitcoin is now back in a range as reported two days ago. While BTC/USD is up to $4,630, the important levels to watch haven’t changed. We need a breakout above $5,000 to restart the rally. A move below the $3,600 swing low could begin a new downtrend in prices.
Start crypto bitcoin trading with FXOpen.
FXOpen offers the world's most popular cryptocurrency CFDs*, including Bitcoin and Ethereum. Floating spreads, 1:2 leverage — at your service. Open your trading account now or learn more about crypto CFD trading with FXOpen.
*At FXOpen UK and FXOpen AU, Cryptocurrency CFDs are only available for trading by those clients categorised as Professional clients under FCA Rules and Professional clients under ASIC Rules respectively. They are not available for trading by Retail clients.
This article represents the opinion of the Companies operating under the FXOpen brand only. It is not to be construed as an offer, solicitation, or recommendation with respect to products and services provided by the Companies operating under the FXOpen brand, nor is it to be considered financial advice.
Latest from Cryptocurrencies
Latest articles

Is There the Best Time to Trade Stock CFDs?
If you ask experienced traders, many will say that they trade on certain days or at certain times of the day. Their choice is determined by the market dynamics, volatility, and liquidity. It’s crucial to understand when the best

UnitedHealth (UNH) Share Price Surges after Strong Report
UnitedHealth shares surged Tuesday, rising more than 5% after the health care giant delivered stronger-than-expected first-quarter 2024 results:
→ earnings per share: actual = USD 6.91, expected = USD 6.61, last quarter = USD 6.16;
→ gross income: actual = USD 94.4

USD/JPY Analysis: Prospect of a Breakout of the Level of 155 Yen per Dollar
The USD/JPY rate has consistently reached new highs since 1990, approaching the psychological level of 155 yen per US dollar. The Japanese currency has already fallen about 9% against the dollar this year.
This is supported by Jerome Powell,