


FXOpen
It’s been a volatile two weeks for crypto trading since our last update. Ether first swung to a new high only to crash close to 30 percent just days later. Dash didn’t do so well either and is now back in a downtrend.
Ether Falls From Highs
Ether prices hit an all-time high of 0.06274 on May 5th. Just four days later a low of 0.04415 was hit on FXOpen, a drop of almost 30 percent from the highs. We’re currently quoted near the 0.05 round figure.
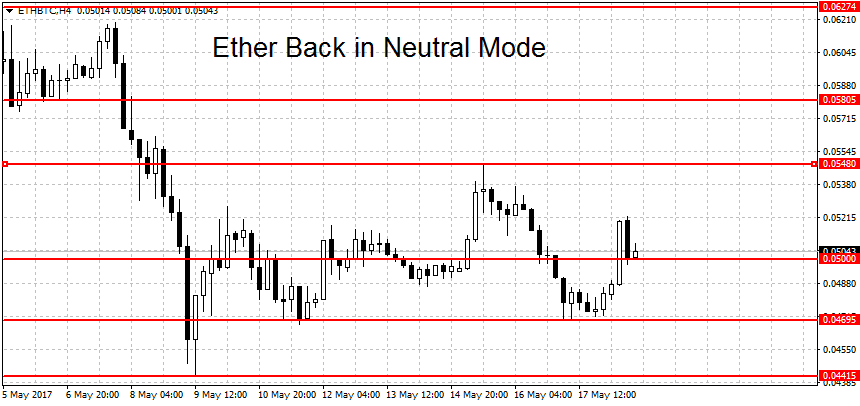
Technically the large drop set ETH/BTC back in neutral mode. A new uptrend requires a decisive breakout above the 0.06274 high. On the other hand, a new downtrend needs a move below the 0.4415 swing low. As usual with these levels, we’re looking for a sustained move above/below the level, not just a quick and shallow spike.
Let’s take a look at some price levels. Above 0.05 the first major resistance is at 0.05480 swing high. This is followed by the 0.06 round figure and of course the all-time high at 0.06274. On the lower end below 0.4415 we have some support at 0.04, followed by the 0.03786 swing low and another swing low at 0.03383 BTC per coin. A breakdown below here could exacerbate the losses. On the long-term charts (weekly and monthly) ETH remains in a bullish trend.
Dash Enters Downtrend
Dash prices have entered a new downtrend. As we said in our previous article, a downtrend needed a move below 0.05476 BTC. Well as you can see on the chart below we broke that level and kept going. Dash is now quoted at 0.04664 BTC, 22 percent down compared to two weeks ago.
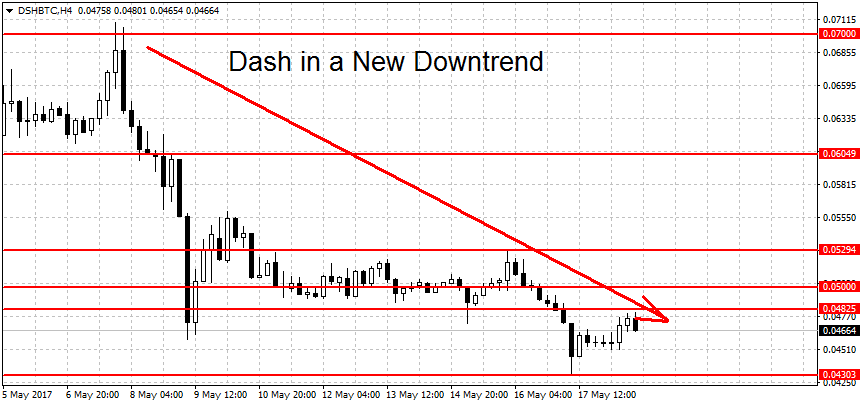
To end the current bearish trend the bulls will have to push DSH/BTC above the 0.06049 swing high. A new rally requires a move above last month’s high at 0.07746. Weak support can be found at 0.04303, yesterday’s low. This is followed by a stronger level at 0.04177, last month’s low for Dash. We have more support bellow here at 0.315, 0.02879 and 0.02478 BTC. The breakout point for the previous rally at 0.0175 should now act as a support to falling prices.
Above we have resistance at the 0.05 round figure, closely followed by the 0.05294 swing high. Higher still we have the trend-ending swing high at 0.06049, followed by the 0.07 round figure and 0.07746 BTC per coin. Then we have the previous support at 0.08024 BTC now turned resistance and the 0.1 round figure. Similarly to Ether, on the weekly and monthly charts, DSH/BTC is still in an uptrend.
FXOpen offers the world's most popular cryptocurrency CFDs*, including Bitcoin and Ethereum. Floating spreads, 1:2 leverage — at your service. Open your trading account now or learn more about crypto CFD trading with FXOpen.
*At FXOpen UK and FXOpen AU, Cryptocurrency CFDs are only available for trading by those clients categorised as Professional clients under FCA Rules and Professional clients under ASIC Rules respectively. They are not available for trading by Retail clients.
This article represents the opinion of the Companies operating under the FXOpen brand only. It is not to be construed as an offer, solicitation, or recommendation with respect to products and services provided by the Companies operating under the FXOpen brand, nor is it to be considered financial advice.
Latest from Cryptocurrencies
Latest articles

Since the Start of the Week, Brent Oil Price Has Dropped over 4%
At the beginning of the week, March 15, we wrote that the price of Brent oil could form a correction from the resistance level of USD 91 per barrel. Since then, the price has decreased by more than 4% due

Fair Value Gaps vs Liquidity Voids in Trading
Understanding fair value gaps and liquidity voids is essential for traders seeking to navigate the complexities of the financial markets. These concepts, deeply rooted in the Smart Money Concept (SMC), provide valuable insights into the dynamics of supply and demand,

UK100 Share Index Rises as UK Inflation Slows
Yesterday, the UK Office for National Statistics (ONS) reported that the CPI stood at 3.2% in March. According to ForexFactory, analysts expected 3.1%, and a month ago the index was 3.4%.
Grant Fitzner, chief economist at the