


FXOpen
It’s a mixed bag for the two cryptos we will cover in today’s article. While Dash managed to stage a successful breakout last week, ETH prices didn’t get very far and soon retraced all gains.
False Breakout for Ether
Ether prices had a false breakout last week. On February 14th prices surged from 0.01125 to a high of 0.01321. But by day four of the rally we had a 50% retracement and by day eight all of the gains were lost.
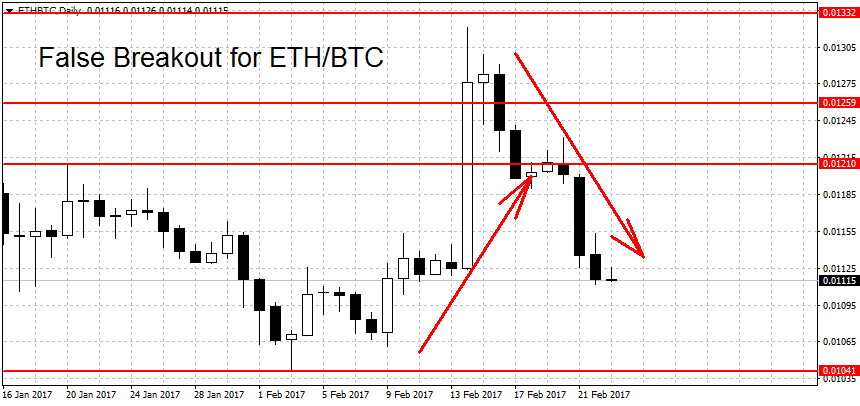
We’re now back in range for ETH/BTC. A new uptrend requires a breakout above 0.01332. Above here resistance can be found at the 0.01382 swing high and the 0.015 round figure.
A new downtrend needs a breakdown beyond the 0.01041 figure. We have support below here at the 0.01 round figure closely followed by 0.0089 BTC and 0.00784. Lower still we have the December low at 0.0073 as another potential support, followed by the semi-round figure at 0.05 BTC. On the longer-term charts (weekly) Ether has switched from bearish to neutral.
Dash Breaks Out Higher
Unlike ETH, Dash managed to stage a successful breakout higher. The move came a day later than Ether, on February 15th. Dash prices spiked from 0.01722 to a high of 0.01959 on that day, leapfrogging over the resistance at 0.01746 BTC. The day after saw a brief pause but the uptrend resumed shortly. We are currently quoted at 0.01969 BTC, a gain of exactly 21 percent compared to two weeks ago.
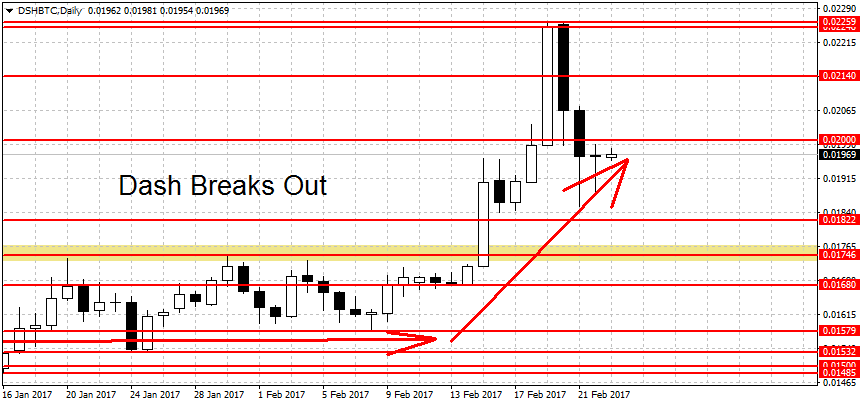
What’s next for DSH/BTC? The uptrend is still unbroken. We have two weaker resistance levels at 0.02 and 0.02140. These are followed by a stronger resistance at 0.02259 BTC, this month’s high for Dash.
To end the current rally the bears will have to push prices below 0.01680. Lucky for the bulls, however, this support sits below a much stronger level at 0.01746 BTC. Like we said in our article on February 9th, this is where a quadruple top had formed. Back then this level was resistance to be broken, it now turns to support. It’s unlikely to give way to the bears at first try unless we get major news.
A move below the 0.01579 swing low could start a new downtrend. Support below here can be found at the 0.015 round figure, closely followed by the 0.01485 swing low. The next several support levels are at 0.01215 and 0.01104, followed by the last year’s low for at 0.01003. This level along with the 0.01 round figure is a strong support area. A break below here could lead to more losses.
FXOpen offers the world's most popular cryptocurrency CFDs*, including Bitcoin and Ethereum. Floating spreads, 1:2 leverage — at your service. Open your trading account now or learn more about crypto CFD trading with FXOpen.
*At FXOpen UK and FXOpen AU, Cryptocurrency CFDs are only available for trading by those clients categorised as Professional clients under FCA Rules and Professional clients under ASIC Rules respectively. They are not available for trading by Retail clients.
This article represents the opinion of the Companies operating under the FXOpen brand only. It is not to be construed as an offer, solicitation, or recommendation with respect to products and services provided by the Companies operating under the FXOpen brand, nor is it to be considered financial advice.
Latest articles

Germany's DAX 40 Index Flying High Despite Pessimistic National Outlook
For a number of years now, there has been a lot of discourse over the current situation and the future of the German domestic economy.
From both inside Germany and globally, analysts, government officials, and corporate leaders have demonstrated a

Volatility in the Pound Is Rising, the Euro is Consolidating
GBP/USD
At the end of last week, the British currency fell sharply, testing a significant support level at 1.2300. The resumption of the downward trend for the pair became possible after some statements by British officials:
- On Wednesday,

The Price of Gold XAU/USD Shows Strongest Fall in Almost 2 Years
On Monday, the price of gold fell from USD 2,386 to USD 2,333 per ounce — this is the strongest drop in one day in almost 2 years, according to Bloomberg. On Tuesday morning in the Asian session, the