


FXOpen
BTC/USD
Last Monday when the price of Bitcoin was sitting at $6976 we have seen an increase of 18.88% measured to the weekly high at $8294 made on Thursday but immediately after reaching those levels, the price fell sharply and steeply as it came down by 14.36% on the following day coming to around $7100. From Friday and throughout the weekend the price has recovered close to the level of Thursday’s high at $8200 on Monday’s open.
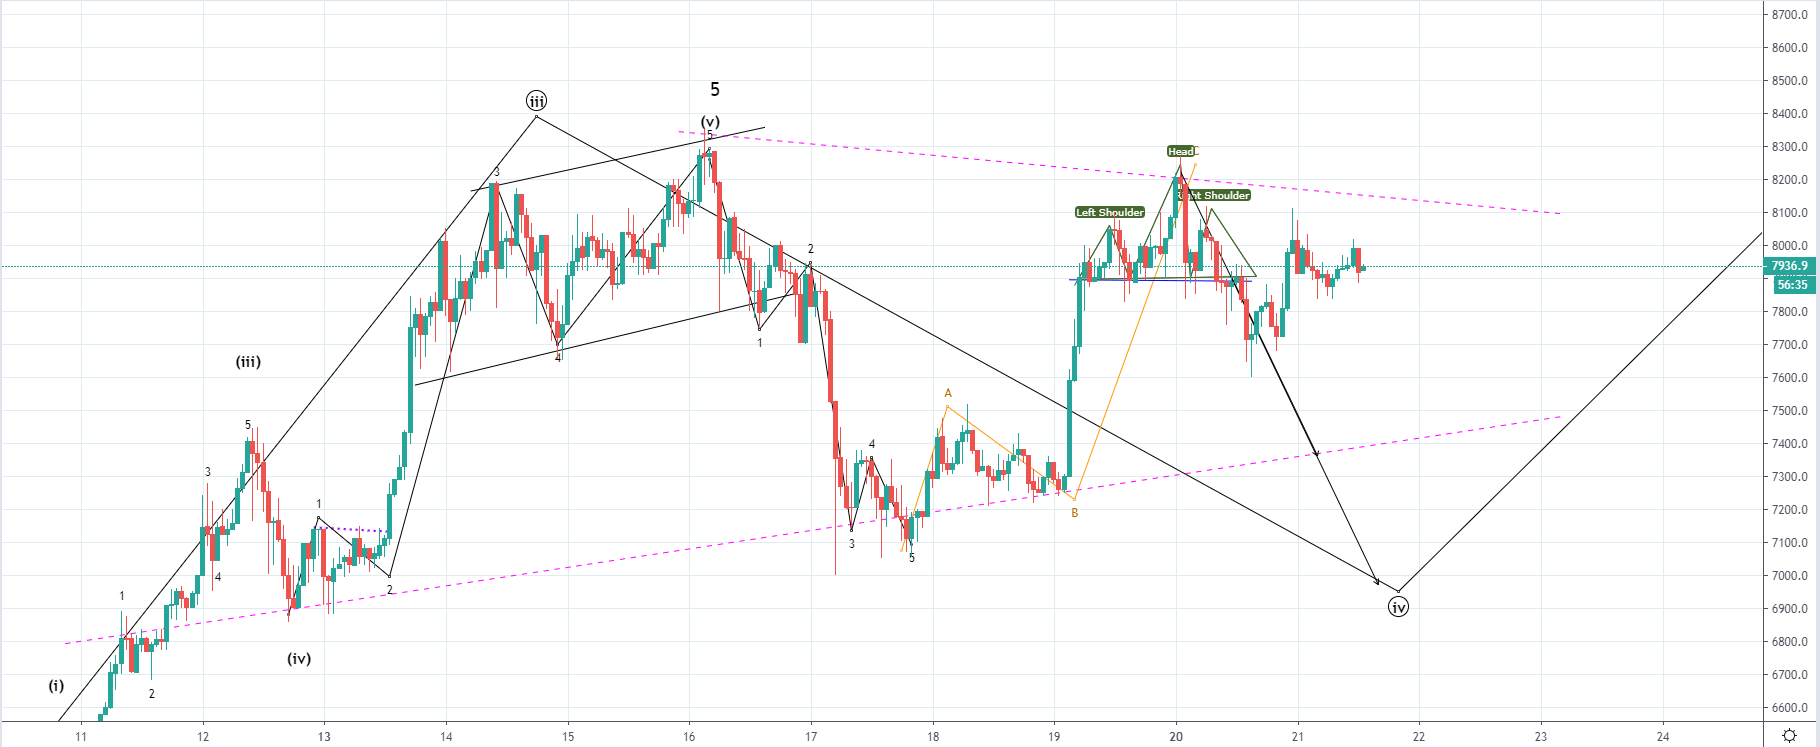
From Monday the price has been decreasing and came down to $7676 as the price action created a head and shoulder pattern which is considered to be the “top” pattern. As the price fell another upside move has been made after but with the price struggling to exceed the Monday’s high before showing signs of weakness as it encountered resistance below it at around $8020. The price is currently being traded at $7936 and has been in an upward trajectory since yesterday but as it hadn’t exceeded the previous high on the yesterday’s upward momentum it is now likely headed down to some of the significant support levels out of which the currently most significant one would be the ascending trendline made from 11th of April.
Last Thursday the price reached the end of the 5th impulsive move of the lower degree count which is why we’ve seen a straight downfall after. As this downfall was made in a five-wave manner the increase that followed is likely a correctional one if it ends as a three-wave move, and considering that the price has shown the signs of weakness it is likely to end as a three-wave increase. This still hasn’t been confirmed as the price hasn’t fallen below the invalidation levels and hasn’t come up above the prior high which would mean that the move has been made in five waves.
This makes the outlook uncertain but the most likely outcome would be that we have seen the end of the higher degree 5th wave of the Minor count on last Thursday in which case the price action movement that followed would be viewed as correctional one. The other possibility would be that price is now headed for further upside movement with the increase seen from Friday being the start of the next five-wave increase but considering the resistance shown and the impulsiveness behind the decrease seen last week I don’t believe that’s likely.
More likely we are seeing the higher degree move to the downside out of which the last weeks decrease is its starting wave with the increase seen after being a correctional second wave of a higher degree. This would soon be verified as the price is to shortly interact with some of the significant levels but for now, I would be expecting further downside movements potently back below $7000.
XRP/USD
From last Thursday the price of Ripple has fallen by 22.39% as it came down to $0.36952 on the following day. Over the weekend we’ve seen a slight recovery above the 0.768 Fibonacci level but only as a quick spike as the price immediately after started moving below it and is currently sitting at the 0.618 Fibonacci level where it has been establishing support around $0.39 area.
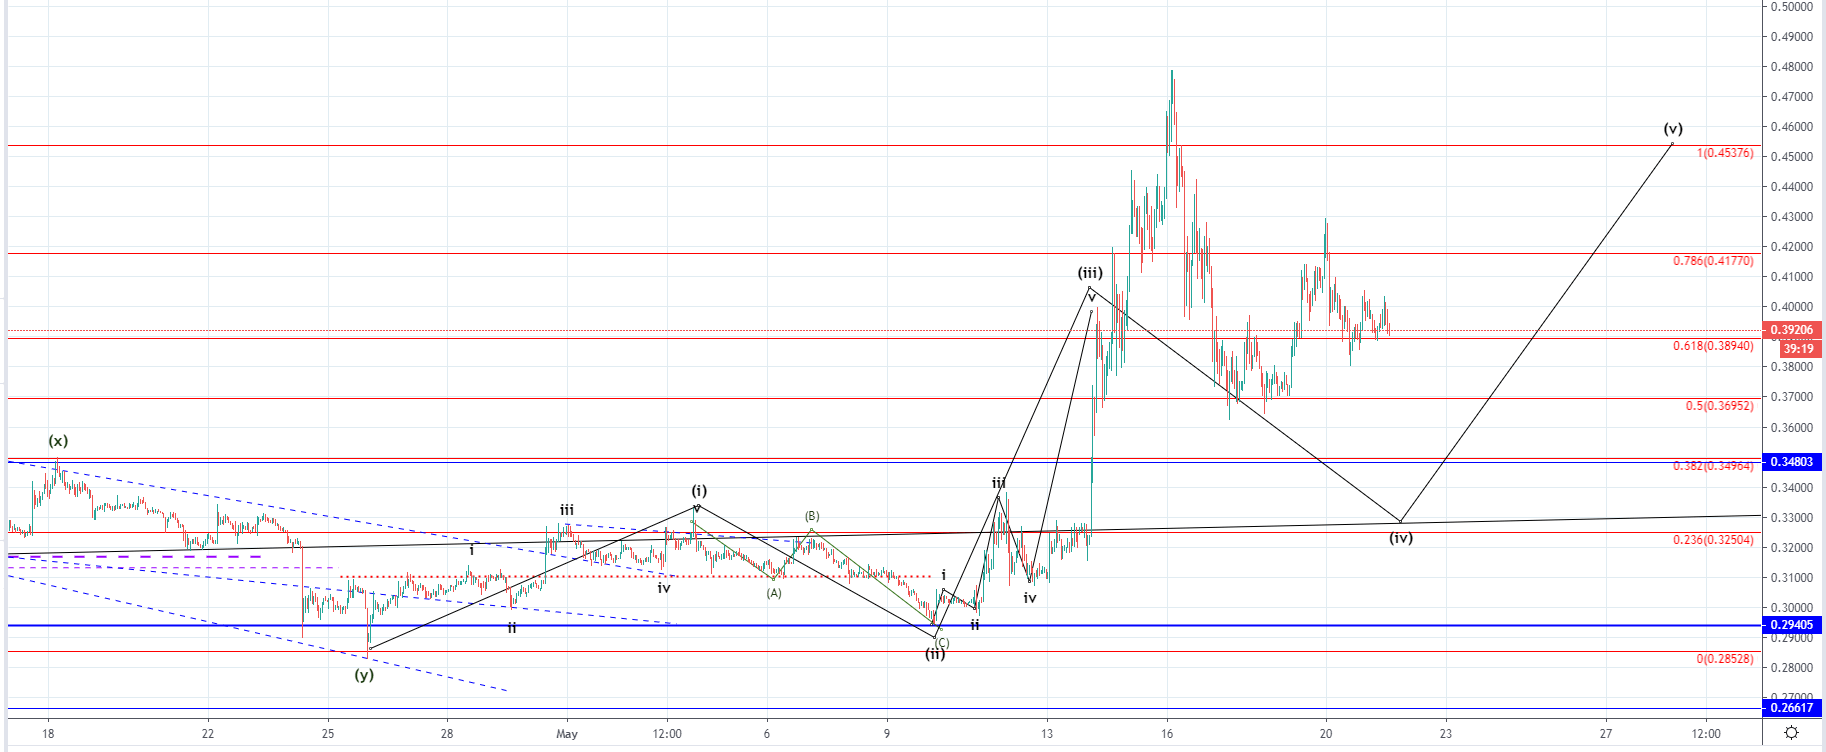
As you can see from the hourly chart the upward movement was expected and the price came to the significant Fibonacci level on the upward movement but it is still unclear weather or not this was the end of the expected five-wave increase as the spike to the 1 Fibonacci level could have been the 3rd wave. If this is true that the decrease that followed would be the 4th wave with the final one shortly coming and would set to exceed the last weeks high at around $0.4762.
If the price stays above the 0.618 Fibonacci level before continuing further upside movement we could likely see another increase above the prior high as the 5th wave would develop, but if the price continues moving to the downside and falls below the 0.236 Fibonacci level it would mean that the five-wave increase ended and that the increase seen from last Friday until today is correctional in nature and is a continuation of the 22.39% downfall.
If this were to be true, then we are to see further downside movement for the price of Ripple below the significant horizontal support level found around the 0.5 Fibonacci level but it still needs to be confirmed. If we are seeing the development of another five-wave impulse from last Friday instead of the correctional three-wave move the price cannot fall below the 0.618 Fibonacci level as it would enter the territory of the second wave which it cannot do on the presumed 4th wave which is currently developing and is why the 0.618 Fibonacci level is viewed as a pivot point.
FXOpen offers the world's most popular cryptocurrency CFDs*, including Bitcoin and Ethereum. Floating spreads, 1:2 leverage — at your service. Open your trading account now or learn more about crypto CFD trading with FXOpen.
*At FXOpen UK and FXOpen AU, Cryptocurrency CFDs are only available for trading by those clients categorised as Professional clients under FCA Rules and Professional clients under ASIC Rules respectively. They are not available for trading by Retail clients.
This article represents the opinion of the Companies operating under the FXOpen brand only. It is not to be construed as an offer, solicitation, or recommendation with respect to products and services provided by the Companies operating under the FXOpen brand, nor is it to be considered financial advice.
Latest articles

AUD/USD Rises Sharply on Inflation News
The Consumer Price Index for Australia was released this morning. According to ForexFactory:
→ CPI in quarterly terms: actual = 1.0%, expected = 0.8%, previous value = 0.6%;
→ CPI in annual terms: actual = 3.5%, expected = 3.4%, previous value = 3.

TSLA Share Price Up About 13% Despite Disappointing Report
Yesterday, TSLA trading closed at USD 144.68 per share, after which Tesla reported its results for the 1st quarter:
→ earnings per share: actual = USD 0.45, forecast = USD 0.49;
→ gross income: actual = USD 21.45 billion, forecast = USD

Market Analysis: Gold Price Corrects Gains While Oil Price Regains Strength
Gold price rallied above $2,400 before correcting lower. Crude oil price is rising and it could climb further higher toward the $85.50 resistance.
Important Takeaways for Gold and Oil Prices Analysis Today
· Gold price rallied significantly above $2,