


FXOpen
BTC/USD
Over the weekend the price of Bitcoin has continued its bullish trajectory as another increase was made of around 6.69% and the price of Bitcoin increased from $3994.4 on Friday’s low to around $4260 on Sunday’s highest point. But since the price came to those levels it started falling down fast and came to $3831 at its lowest point yesterday, which was a decrease of 10.16%. The price is currently sitting at $3890, slightly higher than its lowest point yesterday, but also slightly lower than its highest point at $3962.
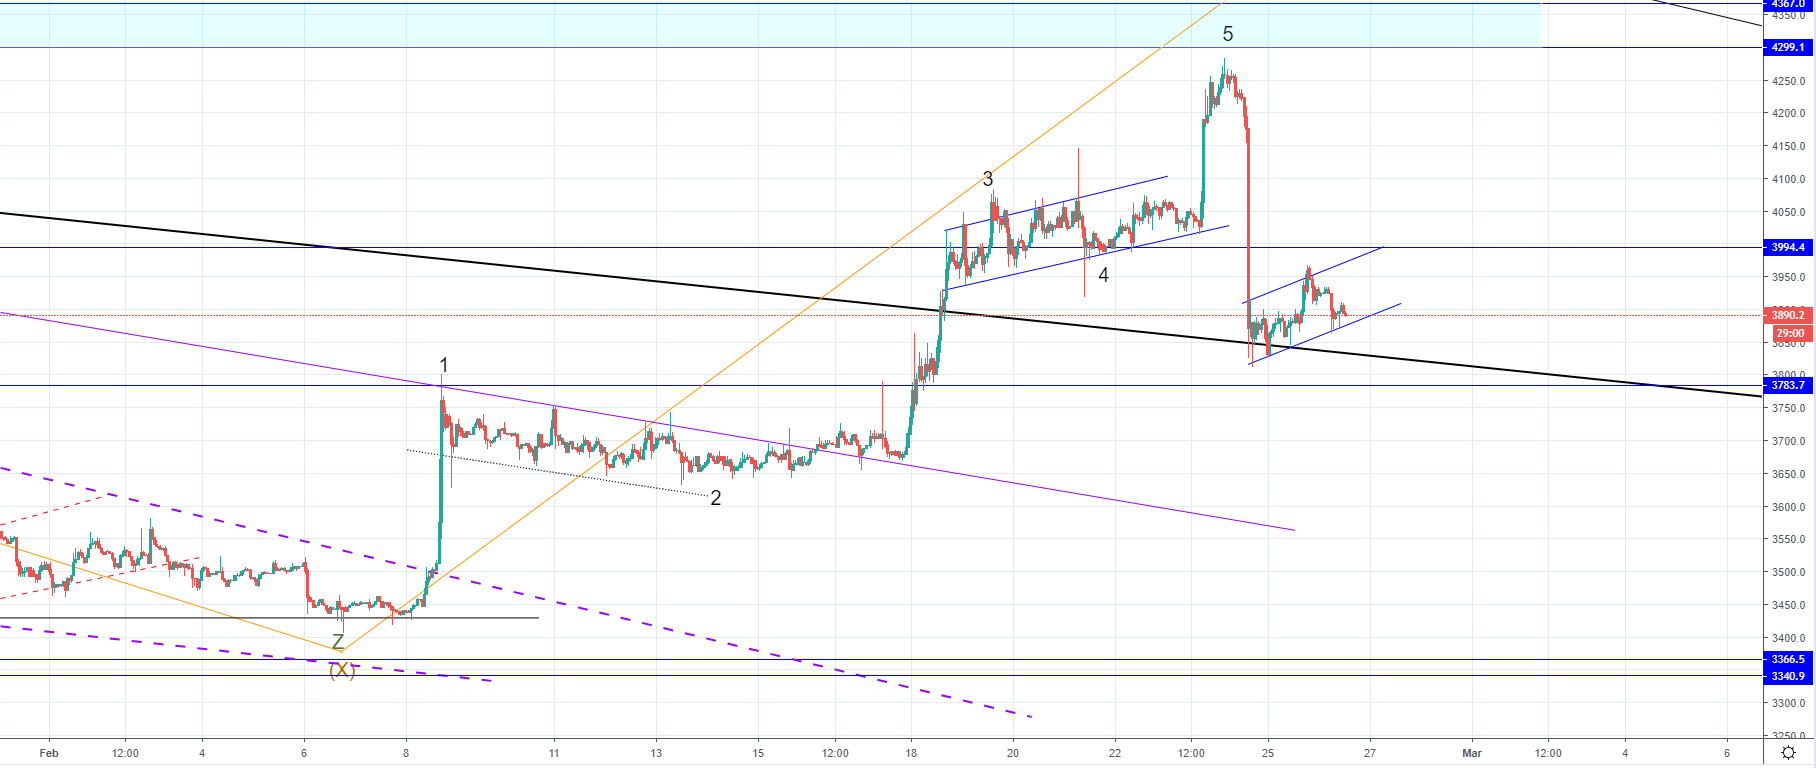
Looking at the hourly chart, we can see that the price has interacted with the baseline support (bold black line) on yesterday’s low. It was the most significant resistance point to the upside and is the most significant support line from the start of the bear market. The price action created an ascending channel, which could likely end as a retest of the $3994.4 horizontal resistance level. It was broken on the yesterday’s decrease.
The 5 wave impulse ended, so did the Intermediate wave Y from the WXY correction that started around 15th of December last year. This downfall was expected and considering the power behind the sellers’ momentum, we could very likely be seeing the start of the trend continuation as the correction to the upside ended. This will soon be validated as the price of Bitcoin could start decreasing again. And considering the price context this ascending channel would most likely serve as consolidation before another downfall below the bold black line.
We could see the WXY correction prolongation where more sideways movement could occur with a potential increase at the ends on the Z wave. But considering the momentum shown yesterday, I don’t believe that is likely to happen.
XRP/USD
From Friday’s low at $0.32225 the price of Ripple has increased at first by 8.58% as came up to $0.3496 at its highest point on Sunday. But like in the case of Bitcoin when the increase ended the price started falling down fast with a 13% drop as it came to $0.3042 at its lowest point yesterday.
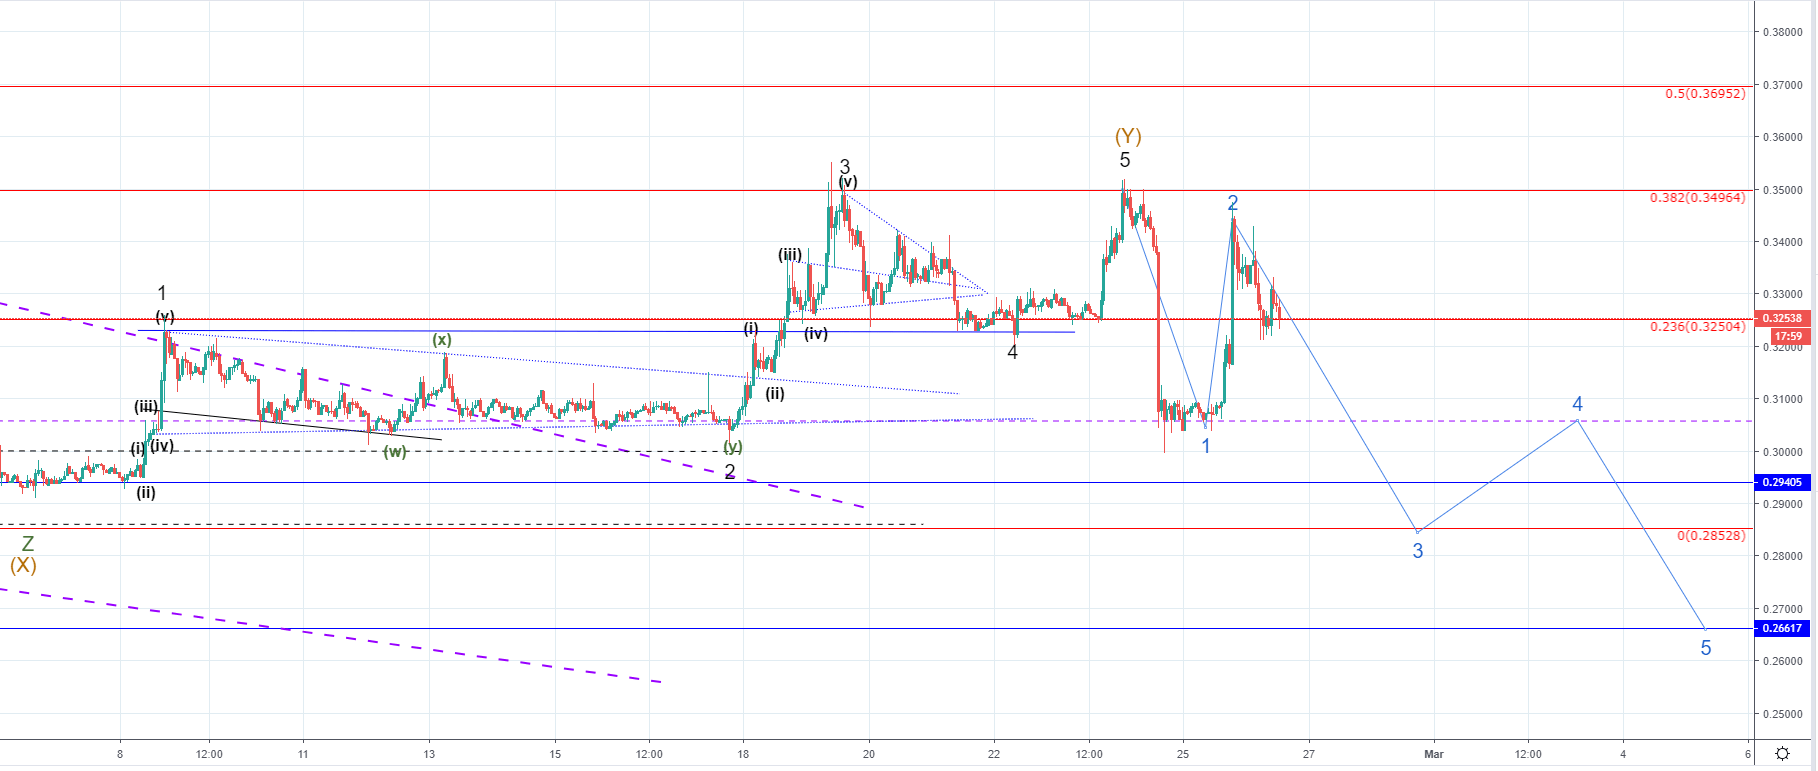
Looking at the hourly chart, you can see that from yesterday’s low the price increased again with strong momentum of around 12.77% to the upside and came to $0.34362 at its highest point yesterday. But another descending structure started forming and the price is currently searching for support at around 0.236 Fibonacci level.
Like in the case of Bitcoin my primary count on the chart of Ripple is that the Intermediate Y wave ended as I have counted 5 waves. So if this is true we are seeing the start of a trend continuation to the downside out of which the yesterday’s increase could be the second wave, which came slightly below the beginning point of the potential first wave to the downside.
This could be another minor correction and a prolongation of the previous one where we could see further correctional movements. But since yesterday’s increase hasn’t in any way negatively impacted my projection, the primary count still stands.
FXOpen offers the world's most popular cryptocurrency CFDs*, including Bitcoin and Ethereum. Floating spreads, 1:2 leverage — at your service. Open your trading account now or learn more about crypto CFD trading with FXOpen.
*At FXOpen UK and FXOpen AU, Cryptocurrency CFDs are only available for trading by those clients categorised as Professional clients under FCA Rules and Professional clients under ASIC Rules respectively. They are not available for trading by Retail clients.
This article represents the opinion of the Companies operating under the FXOpen brand only. It is not to be construed as an offer, solicitation, or recommendation with respect to products and services provided by the Companies operating under the FXOpen brand, nor is it to be considered financial advice.
Latest from Cryptocurrencies
Latest articles

Weekly Market Wrap With Gary Thomson: UK100, USD, GOLD, OIL
Get the latest scoop on the week's hottest headlines, all in one convenient video. Join Gary Thomson, the COO of FXOpen UK, as he breaks down the most significant news reports and shares his expert insights.
- UK100 Share Index Rises

What Is a Darvas Box Theory and How Does It Work in Trading?
The Darvas Box Theory, pioneered by Nicolas Darvas in the 1950s, has transcended its stock market origins to become a valuable tool for forex traders. This method leverages specific price movements and patterns, known as the Darvas Box, to track

NFLX Stock Price Falls Despite Subscriber Growth
Yesterday, after the close of the main trading session on the stock market, Netflix reported to investors for the 1st quarter of 2024.
The report turned out better than expected:
→ earnings per share: actual = USD 5.28, forecast = USD 4.