


FXOpen
BTC/USD
From last week’s analysis on Tuesday, February 12th, when the price of Bitcoin was $3659 at its lowest point, the price has increased by 10.15% from today’s highest point of $4029. The price is currently at $3976.5, lower than the horizontal resistance at $3994.4 where the price has encountered resistance.
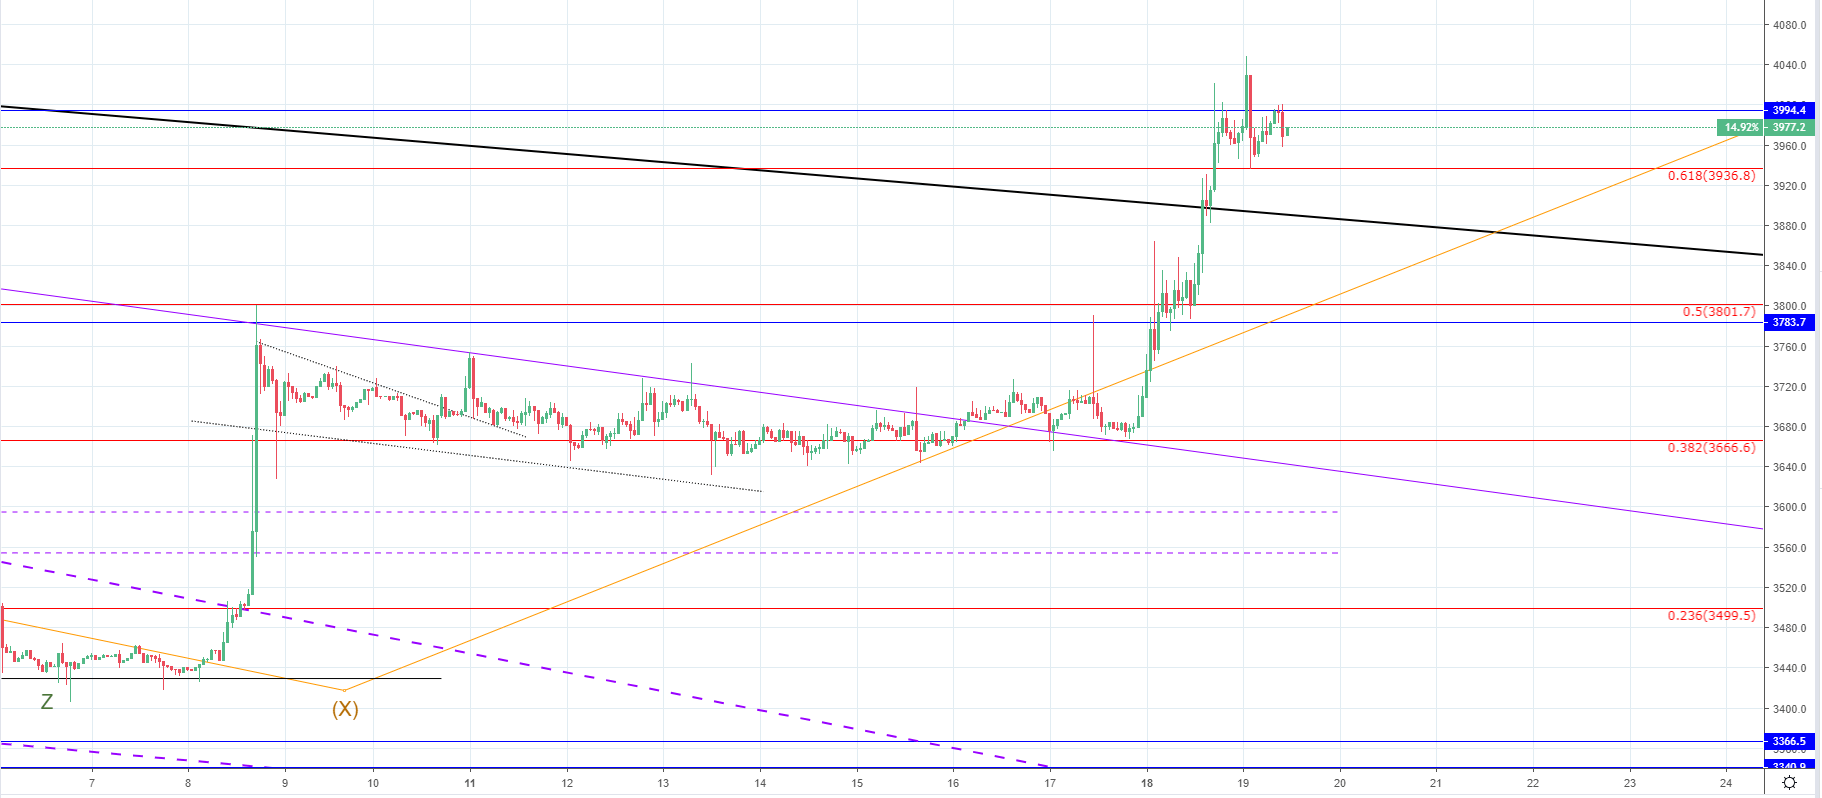
Looking at the hourly chart, you can see that the price broke out from the descending channel in which it was retracing since the first increase to the upside made on Friday 8th. The retracement was more of consolidation since we have seen it throughout the last 10 days. Strong momentum was shown as the price broke out many of the significant resistance points to the upside. The most significant one is the bold black line, which is the baseline support since the start of the bear market and was serving as resistance when it got broken on 21st of November last year.
The price is currently inside a horizontal range between the 0.618 Fibonacci level, which serves as a support, and the horizontal resistance at $3994.4. So we are seeing a cluster starting to form as the price is consolidating again after an exponential increase. If the price wants to continue the upward trajectory it needs to retest some of the broken resistance levels for support. And since the bold black line was the most significant resistance point we could likely see a pullback to its level potentially in a form of a descending triangle or a channel like we saw after the first impulsive increase.
Since my primary count got validated, where the Minor WXYXZ correction was the Intermediate X wave, this increase from the Friday 8th is considered the Intermediate Y wave. If this is true then a five-wave structure is to develop out of which we are currently seeing the 3rd wave. This current increase which is considered the 3rd wave may not have ended so we are soon going to see a confirmation in a form of a direction of a breakout from the current range.
XRP/USD
From last Tuesday when the price of Ripple was $0.30344 at its lowest point to today’s high at $0.3548 we have seen an increase of 16.78%. From today’s spike, the price has fallen quickly leaving a wick from the upside on the hourly chart and is currently sitting at $0.34592.
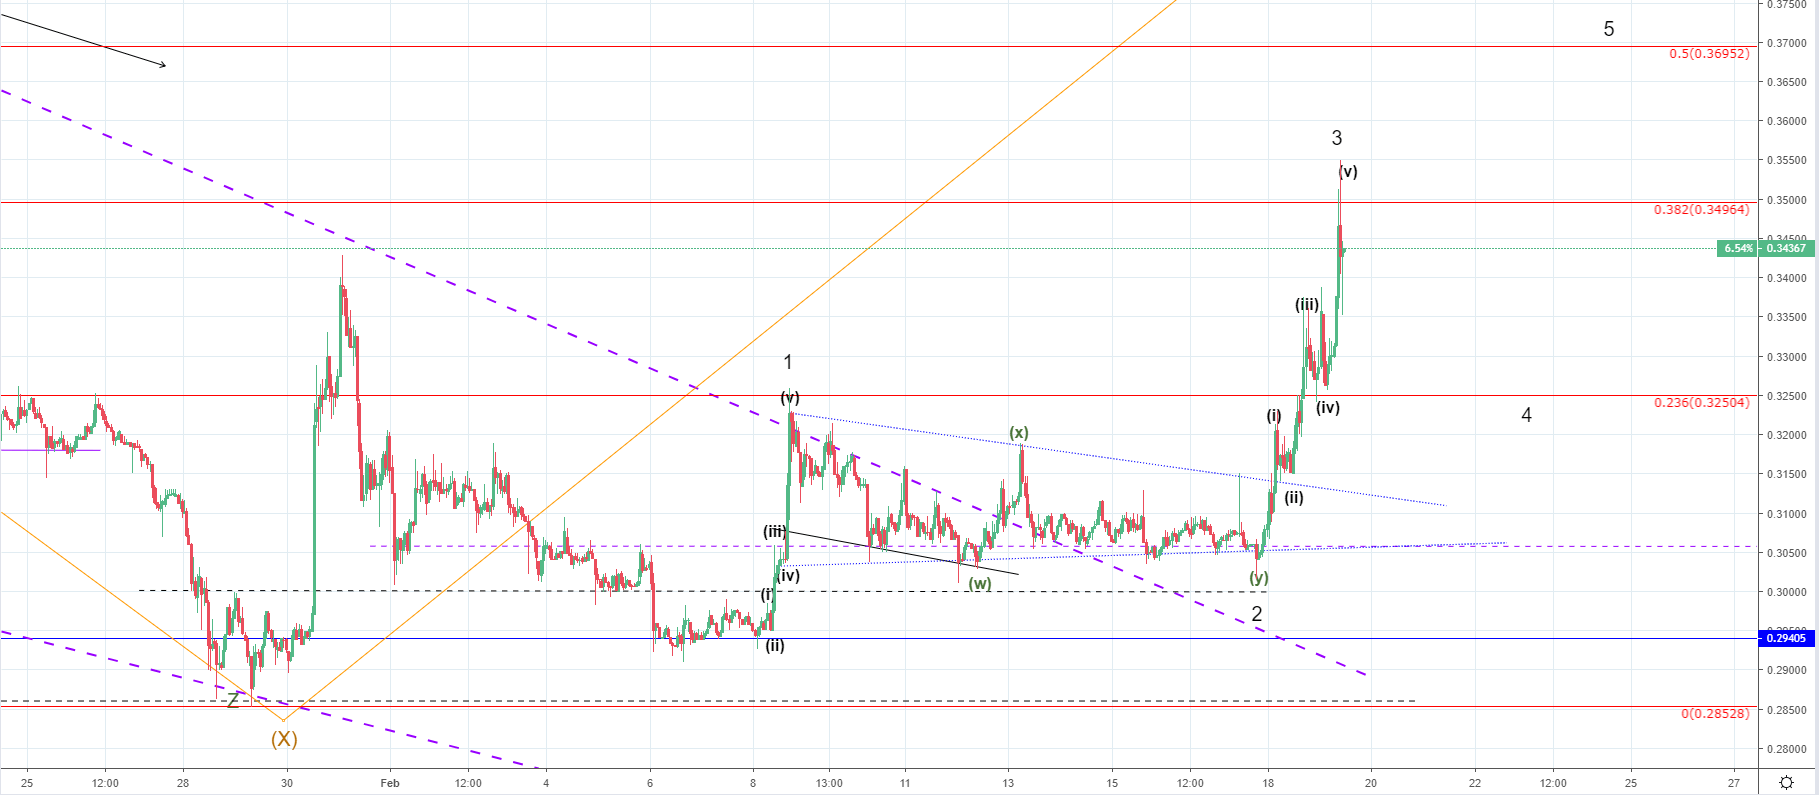
Looking at the hourly chart, you can see that my Elliott Wave count implies that this was the end of the 3rd wave, so now we are likely going to see some correctional movement much like what is expected in the case of Bitcoin. Some significant resistance points have been broken, out of which the most significant one is the horizontal resistance at the 0.236 Fibonacci level. The ending point of the 1st wave which could be interacted with on the 4th that is expected to develop.
This means that further increase could be expected afterward as the final 5th wave should start developing to the upside and the potential target would be at the next Fibonacci level at $0.36952.
FXOpen offers the world's most popular cryptocurrency CFDs*, including Bitcoin and Ethereum. Floating spreads, 1:2 leverage — at your service. Open your trading account now or learn more about crypto CFD trading with FXOpen.
*At FXOpen UK and FXOpen AU, Cryptocurrency CFDs are only available for trading by those clients categorised as Professional clients under FCA Rules and Professional clients under ASIC Rules respectively. They are not available for trading by Retail clients.
This article represents the opinion of the Companies operating under the FXOpen brand only. It is not to be construed as an offer, solicitation, or recommendation with respect to products and services provided by the Companies operating under the FXOpen brand, nor is it to be considered financial advice.
Latest articles

Germany's DAX 40 Index Flying High Despite Pessimistic National Outlook
For a number of years now, there has been a lot of discourse over the current situation and the future of the German domestic economy.
From both inside Germany and globally, analysts, government officials, and corporate leaders have demonstrated a

Volatility in the Pound Is Rising, the Euro is Consolidating
GBP/USD
At the end of last week, the British currency fell sharply, testing a significant support level at 1.2300. The resumption of the downward trend for the pair became possible after some statements by British officials:
- On Wednesday,

The Price of Gold XAU/USD Shows Strongest Fall in Almost 2 Years
On Monday, the price of gold fell from USD 2,386 to USD 2,333 per ounce — this is the strongest drop in one day in almost 2 years, according to Bloomberg. On Tuesday morning in the Asian session, the