


FXOpen
BTC/USD
From 30. of July the price of Bitcoin has increased by 30.92% as it came up to $12317.5 at its highest point coming from $9407. As it encountered resistance a steep downfall has been seen with the price currently being traded at $11875.
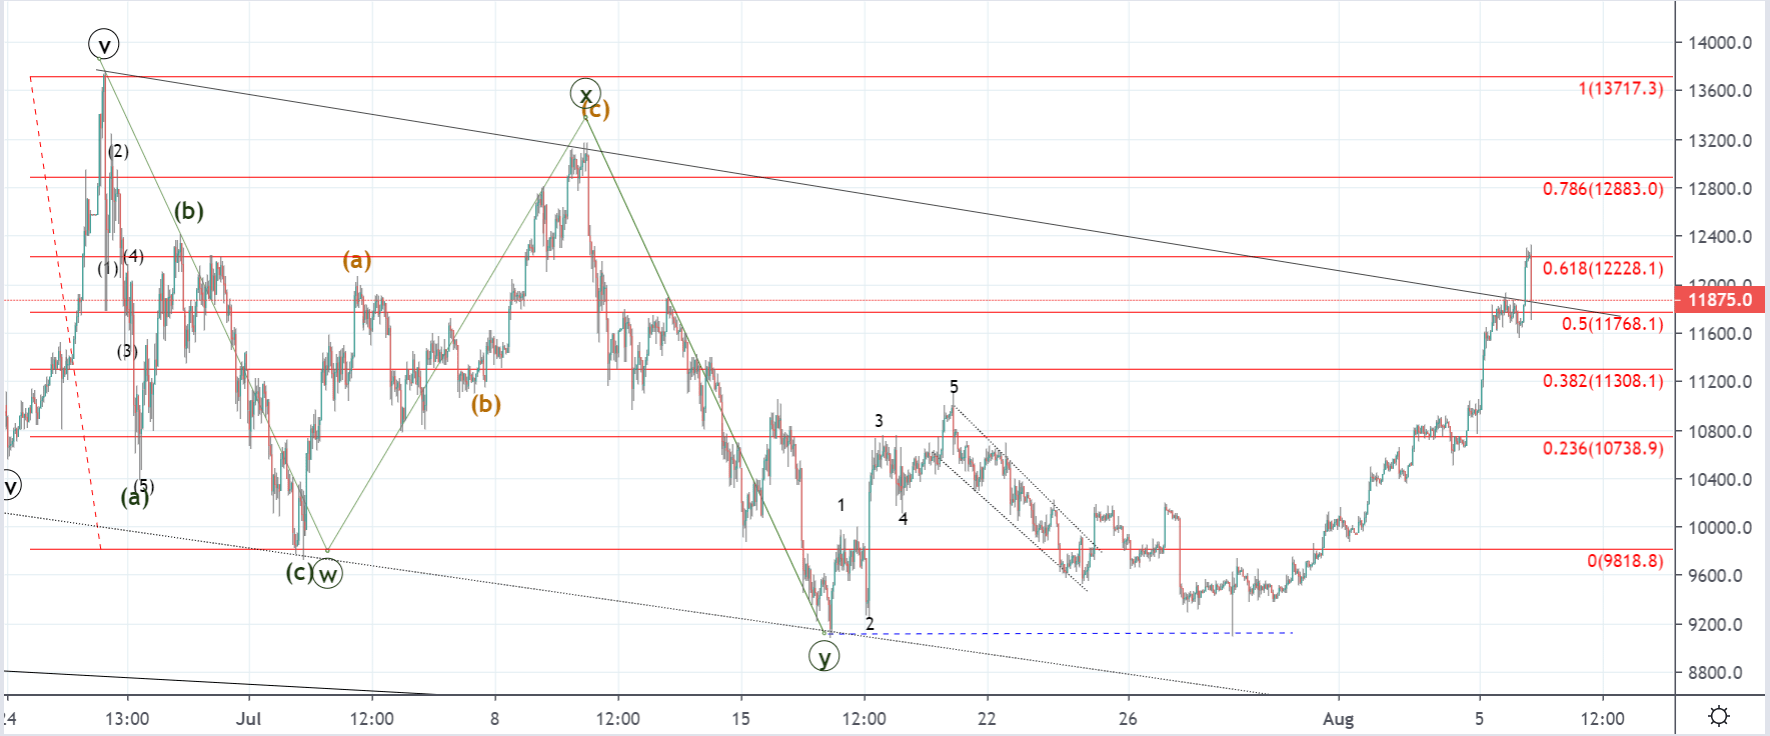 Looking at the hourly chart, you can see that the price came up to the 0.618 Fibonacci level where it found resistance and got rejected. The price came down to retest the broken descending trendline which is the resistance level of the descending channel in which the price action has been bouncing since 26. of June.
If the price finds support on the broken resistance level further increase could be expected to the next Fib level at $12883 but considering the amount of increase in one go and the vicinity of the resistance point, I don’t believe that’s likely.
More likely we are to see the downfall continuation as the price reached overextension and has moved parabolically to the upside. A retracement could end on the 0.382 Fib level if the breakout is to occur above the descending channels resistance, but if the price falls below it the attempt is most likely to end as a fakeout.
Prior to this recovery, we’ve seen the completion of the three-wave correction which is why the next five-wave move a retracement after in conjunction with the last increase could have been the first three waves out of the next five-wave impulse to the upside. But another possibility would be that the recovery ended on a three-wave move retesting the descending channel’s resistance in which case it should be viewed as the WXY correction prolongation.
This would soon be verified by the price action movement in the form of a breakout or a fakeout which is why the 0.382 Fib level serves as an indication point.
XRP/USD
The price of Ripple has been moving sideways since 24. of July when it was sitting around $0.304 at its lowest point. Today the price came up to $0.32882 at its highest point but is currently being traded at $0.31692 as it encountered resistance.
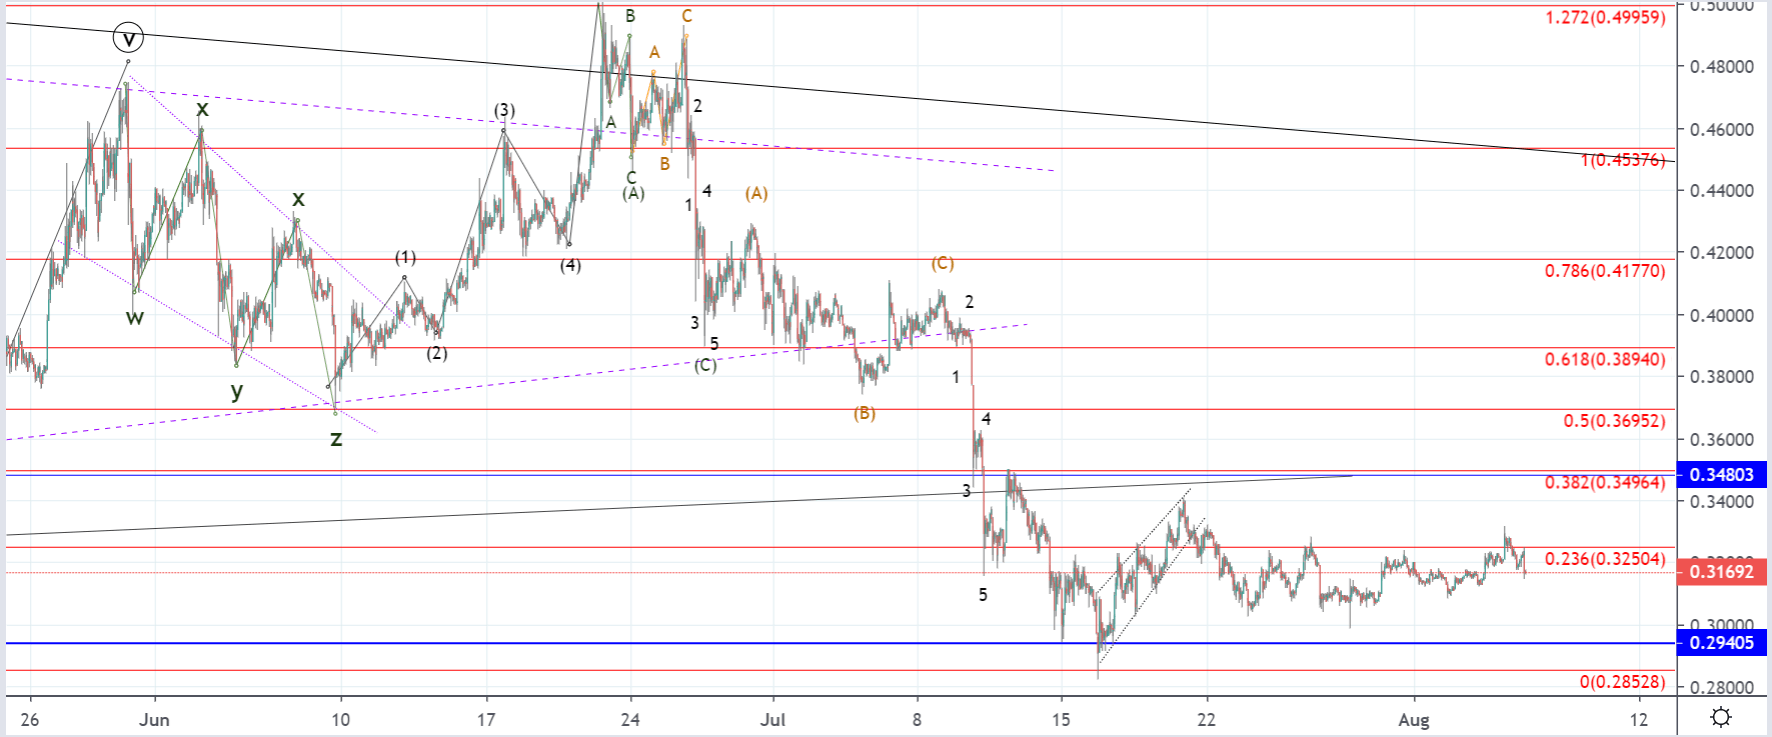 On the hourly chart, you can see that the price started moving above the 0.236 Fibonacci level but as it started entering the seller’s territory the seller’s pressure has pushed it back below it again.
From 30. of July the price of Ripple has been in a slight upward trajectory but it only recovered by 6.94% measured to its highest point today. The recovery might continue if the price finds support on the higher low which could be on the current retest of the minor horizontal resistance level from the sideways range out of which the price is attempting to break out to the upside.
As the price came down to the 0.29405 level previously, retesting it for support I was expecting a potential start of the next five-wave impulse wave to the upside but we haven’t seen the price behaving impulsively which is why we could see another retest of the mentioned significant horizontal support level before a significant recovery could start.
FXOpen offers the world's most popular cryptocurrency CFDs*, including Bitcoin and Ethereum. Floating spreads, 1:2 leverage — at your service. Open your trading account now or learn more about crypto CFD trading with FXOpen.
*At FXOpen UK and FXOpen AU, Cryptocurrency CFDs are only available for trading by those clients categorised as Professional clients under FCA Rules and Professional clients under ASIC Rules respectively. They are not available for trading by Retail clients.
This article represents the opinion of the Companies operating under the FXOpen brand only. It is not to be construed as an offer, solicitation, or recommendation with respect to products and services provided by the Companies operating under the FXOpen brand, nor is it to be considered financial advice.
Latest articles

Anchored VWAP and How You Can Use It in Forex Trading
In the world of forex trading, understanding the nuanced tools at your disposal can significantly enhance decision-making processes. One such sophisticated tool is the Anchored Volume-Weighted Average Price (Anchored VWAP), which refines the standard VWAP by allowing traders to set

META Share Price Collapses after Publication of Quarterly Report
Just yesterday, META's stock price closed at USD 493.50, up approximately 40% since the start of 2024 and up nearly 300% since the start of 2023.
However, following the release of Meta's quarterly report, its shares plummeted to USD

USD/JPY Analysis: The Rate Exceeds The Level of 155 Yen Per US Dollar
Today, the price of USD/JPY once again renewed its 34-year high, exceeding the level of 155 yen per dollar, which put pressure on the current authorities.
According to Reuters, officials are trying to maintain calm in the market.
"We