


FXOpen
BTC/USD
From yesterday’s high at $10976.7 the price of Bitcoin has decreased by 9.62% as it came down to $9920.6 at its lowest point today around which the price is currently being traded.
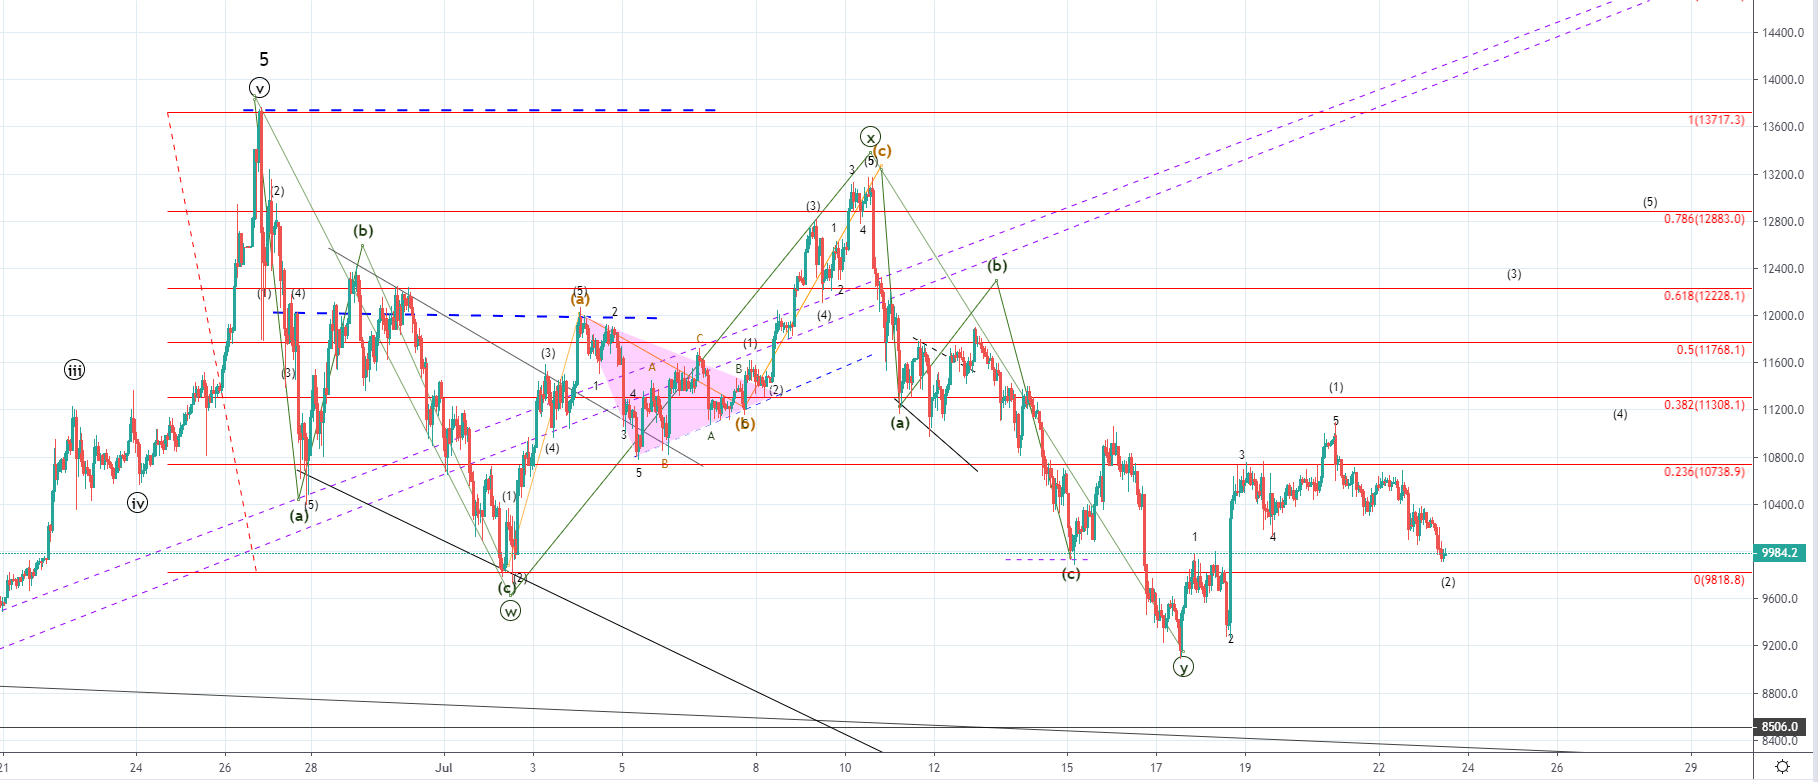
Looking at the hourly chart, you can see that the price came down to the 0 Fib level but there hasn’t been an interaction, as the price found support at the vicinity of the 1st wave’s ending point. As the WXY correction ended an upward five-wave move has been seen developing until yesterday’s high. There could still be a possibility that this wave hasn’t ended as we could be seeing the 4th wave developing.
Considering that the price fell impulsively and broke the significant ascending trendline I don’t believe that the 5h wave hasn’t ended. More likely we’ve seen the completion of the first wave with the downfall from yesterday being the start of the 2nd one.
If the five-wave increase seen from last Wednesday until Sunday’s open was the first sub-wave of the next starting impulse to the upside the downfall from yesterday’s high could continue to its starting point at $9168.3 before we see another upturn but considering the vicinity of the 0 Fib level I don’t believe that the 2nd wave would retrace that much.
This increase might end on the next upward wave as another three-wave corrective move which would mean that the WXY correction got prolonged by two more waves, but for now the projection is that a five-wave increase would occur, most likely above the 0.618 Fib level.
XRP/USD
From yesterday’s high at $0.34129 the price of Ripple fell by 9.54% measured to its lowest point today at $0.30874 around which it is currently being traded.
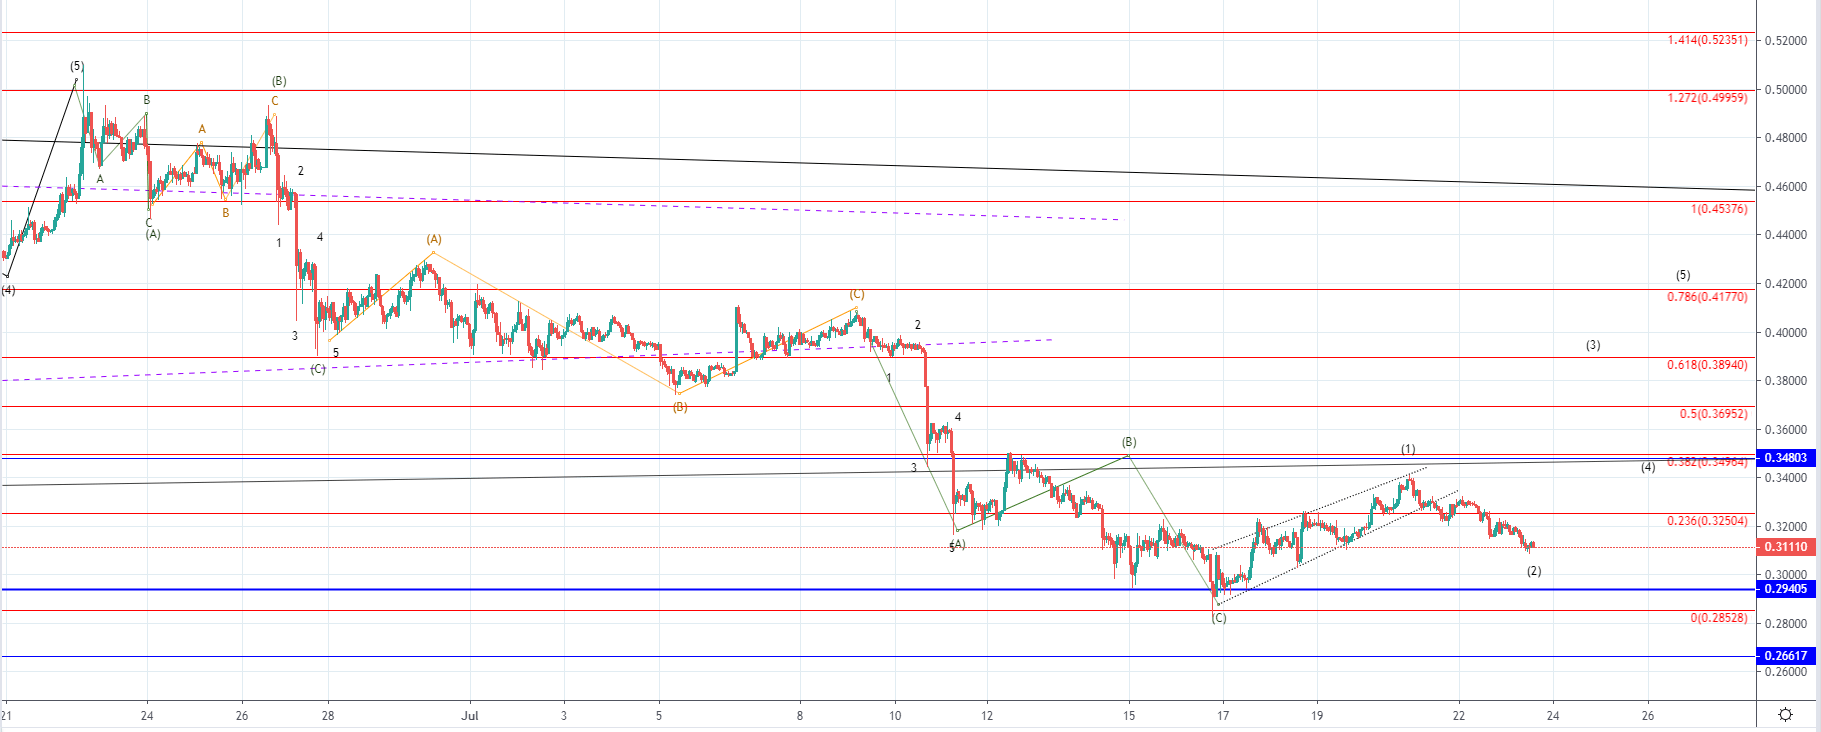 Looking at the hourly chart, you can see that the price broke out off of the ascending triangle as the price came back to retest the significant resistance point at the 0.382 Fibonacci level and the intersection with the higher degree ascending trendline.
This ascending triangle could have been the first wave out of the starting impulse wave to the upside as the corrective wave to the downside ended on the significant horizontal support level at $0.29405. If this is true then we are seeing the 2nd wave developing. The 2nd wave looks near completion but further decrease could be seen before its completion as another retest of the significant horizontal level might occur.
In either way, after this retracement, I would be expecting another increase above the significant resistance point and potentially all the way to the 0.786 Fibonacci level at $0.4177.
FXOpen offers the world's most popular cryptocurrency CFDs*, including Bitcoin and Ethereum. Floating spreads, 1:2 leverage — at your service. Open your trading account now or learn more about crypto CFD trading with FXOpen.
*At FXOpen UK and FXOpen AU, Cryptocurrency CFDs are only available for trading by those clients categorised as Professional clients under FCA Rules and Professional clients under ASIC Rules respectively. They are not available for trading by Retail clients.
This article represents the opinion of the Companies operating under the FXOpen brand only. It is not to be construed as an offer, solicitation, or recommendation with respect to products and services provided by the Companies operating under the FXOpen brand, nor is it to be considered financial advice.
Latest from Cryptocurrencies
Latest articles

What Order Imbalance Is and How To Use It in a Trading Strategy
Understanding the nuances of order imbalances is key for traders looking to navigate the ebb and flow of asset prices. Order imbalances provide a clear window into the supply and demand dynamics at play, offering strategic insights. This article delves

XAU/USD Gold Price Reaches an Important Resistance Zone
The XAU/USD gold chart today indicates that the historical record price of the metal is above USD 2,400 per ounce.
In addition to fears of a new round of inflation due to rising commodity prices, geopolitical tensions are

What Is a Break of Structure and How Can You Trade It?
In the ever-evolving world of Smart Money Concept (SMC) trading, a nuanced understanding of market dynamics is indispensable. This article explores the concept of Break of Structure (BOS), how to identify it, and its implications for trading strategies, setting traders