


FXOpen

BTC/USD
The price of Bitcoin has decreased by 5.64% from yesterday’s open at $8568 as it’s currently being traded at $8089. The price is still in a downward trajectory as the downtrend from the 4th of November hasn’t still developed fully.
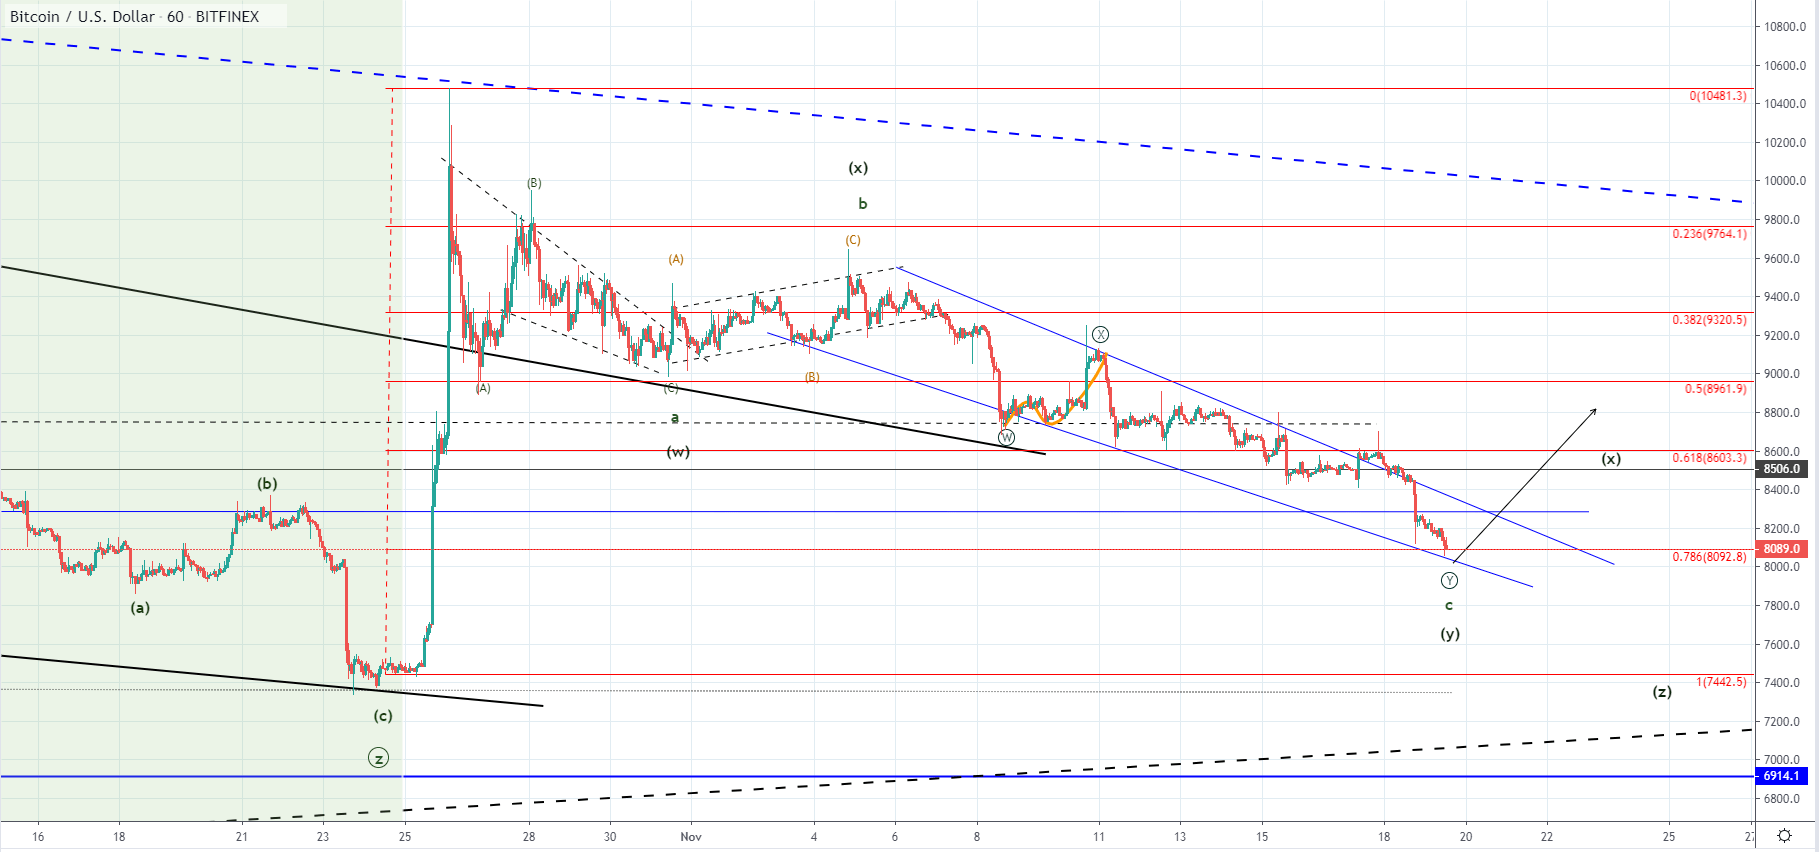 On the hourly chart, we can see that the price fell to the 0.786 Fibonacci level and has retested the descending channels support line. This could indicate the potential support being found and with the wave structure pointing out the competition of the three-wave move this looks likely.
Prior to the depreciation, we have seen a spike to the upside with strong momentum which indicated impulsiveness, so if we are seeing the start of an impulse wave to the upside with the current depreciation being its 2nd wave these levels are its perfect ending point. In theory, the price can fall back to the starting point of the starting impulse on the 2nd wave but considering the power behind the presumed 1st wave this shouldn’t happen.
However, the price fell below the light blue horizontal level which was the resistance point of the previous range and was expected to provide more support then it did. As the price entered the lower horizontal range so it did in a descending one from which a breakout was made when the price spiked to the upside.
This means that we could be seeing another corrective move with the previous spike being the A wave and the current structure is its B wave. After the current decline ends, another five-wave move to the upside would be expected either as a C wave or the 3rd wave from the next impulse wave. So from its momentum and significant level interaction, we are going to evaluate the possibility.
XRP/USD
From yesterday’s high at $0.266 the price of Ripple decreased by 8.27% as it fell to $0.24407 at its lowest point today around which it is currently being traded. The price fell sharply to the 0.786 Fibonacci level and found support above the ending point of the previous 2nd wave. 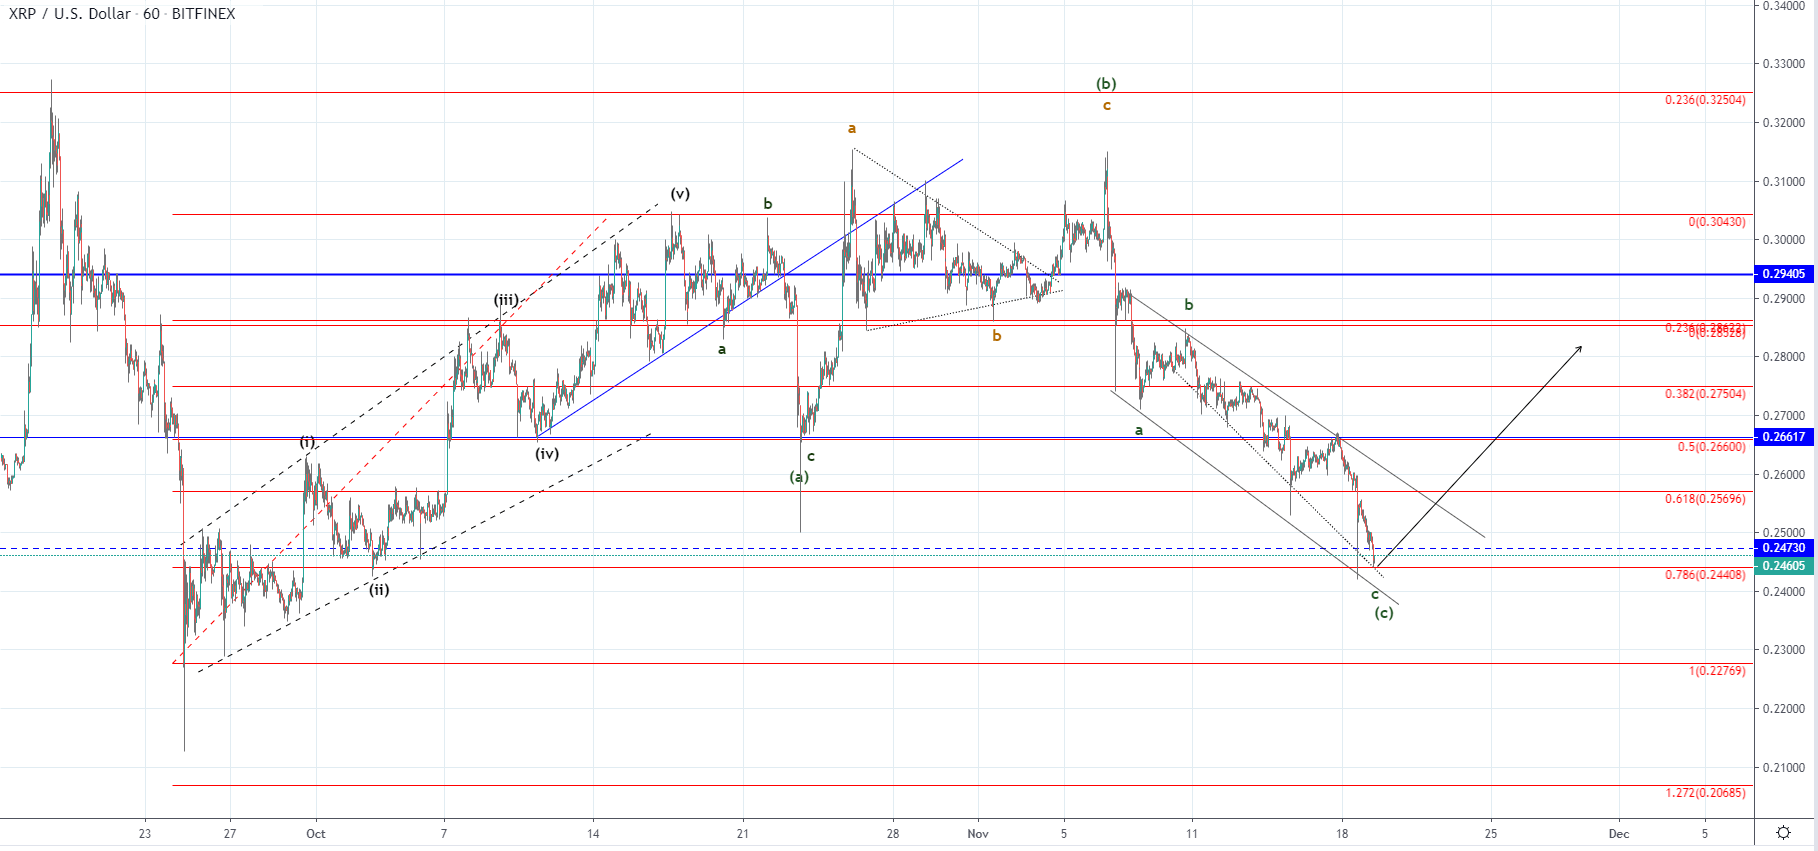 Looking at the hourly chart, we can see that after the five-wave move to the upside ended we have seen two ABC corrections with the decrease from the 7th of November being its third one. If this third ABC correction ended and it looks like it could have, now we are to see the start of the next five-wave move to the upside.
Although this will be evaluated from the momentum behind the increase we could see the price going above the previous high. In that case, the expected move would be the 3rd of the higher degree count but like in the case of Bitcoin it also can be the C wave from yet another corrective structure.
FXOpen offers the world's most popular cryptocurrency CFDs*, including Bitcoin and Ethereum. Floating spreads, 1:2 leverage — at your service. Open your trading account now or learn more about crypto CFD trading with FXOpen.
*Important: At FXOpen UK, Cryptocurrency trading via CFDs is only available to our Professional clients. They are not available for trading by Retail clients. To find out more information about how this may affect you, please get in touch with our team.
This article represents the opinion of the Companies operating under the FXOpen brand only. It is not to be construed as an offer, solicitation, or recommendation with respect to products and services provided by the Companies operating under the FXOpen brand, nor is it to be considered financial advice.
Stay ahead of the market!
Subscribe now to our mailing list and receive the latest market news and insights delivered directly to your inbox.


Latest articles

The Dollar Strengthens Ahead of Employment Data
The USD/JPY and USD/CAD currency pairs are showing an upward trend, supported by the strengthening US dollar, which is backed by a number of factors. At yesterday's meeting, the Bank of Japan kept the key interest rate unchanged,

Microsoft (MSFT) Share Price Jumps Nearly 9% – What’s Next?
As the chart shows, Microsoft (MSFT) shares surged sharply, forming a large bullish gap: while trading closed around $391 on 30 April, yesterday’s candlestick closed just below the $425 mark.
What Drove the Rally in Microsoft Shares?
Microsoft released

BTC/USD Analysis: Two-Month High
In our previous analysis of Bitcoin’s price (21 April), we:
→ identified a long-term ascending channel (marked by blue lines) and suggested that a bullish attempt to test the $90k level could occur before the end of the month.
Now,