


FXOpen
BTC/USD
From last week’s low at $7367 the price of Bitcoin increased by 42.44% spiking to $10494 at its highest point on Saturday. Since then we have seen a retracement developing with the price currently being at its median point at around $9500.
 On the hourly chart we can see that the price action formed a symmetrical triangle from last weeks high above the 1 Fib level which is the horizontal support level from the first WXY correction made on the 17th of July and below which the price hasn’t declined until the 24th of September when a breakdown with strong momentum occurred leading the price of Bitcoin to $7883 or the 1.272 Fib level.
Looking at the wave structure we can see that the previous increase ended as a five-wave move to the upside. As this was an impulsive move the current structure is viewed as a retracement. Since the ending point of the last week’s spike, we have seen a five-wave move to the downside followed by a three-wave increase. This looks like the development of an ABC move to the downside which would mean that another 12345 move should develop.
I have already counted a five-wave move of the third wave but I believe that its the one of the lower degree count which means that further lows would be expected. There could be a possibility that the ABC correction ended in which case we will see a breakout to the upside above the triangle’s resistance which can serve as a pivot point.
XRP/USD
The price of Ripple has today interacted with the ascending trendline which served as support but now serves as resistance which is why the interaction ended as a rejection. 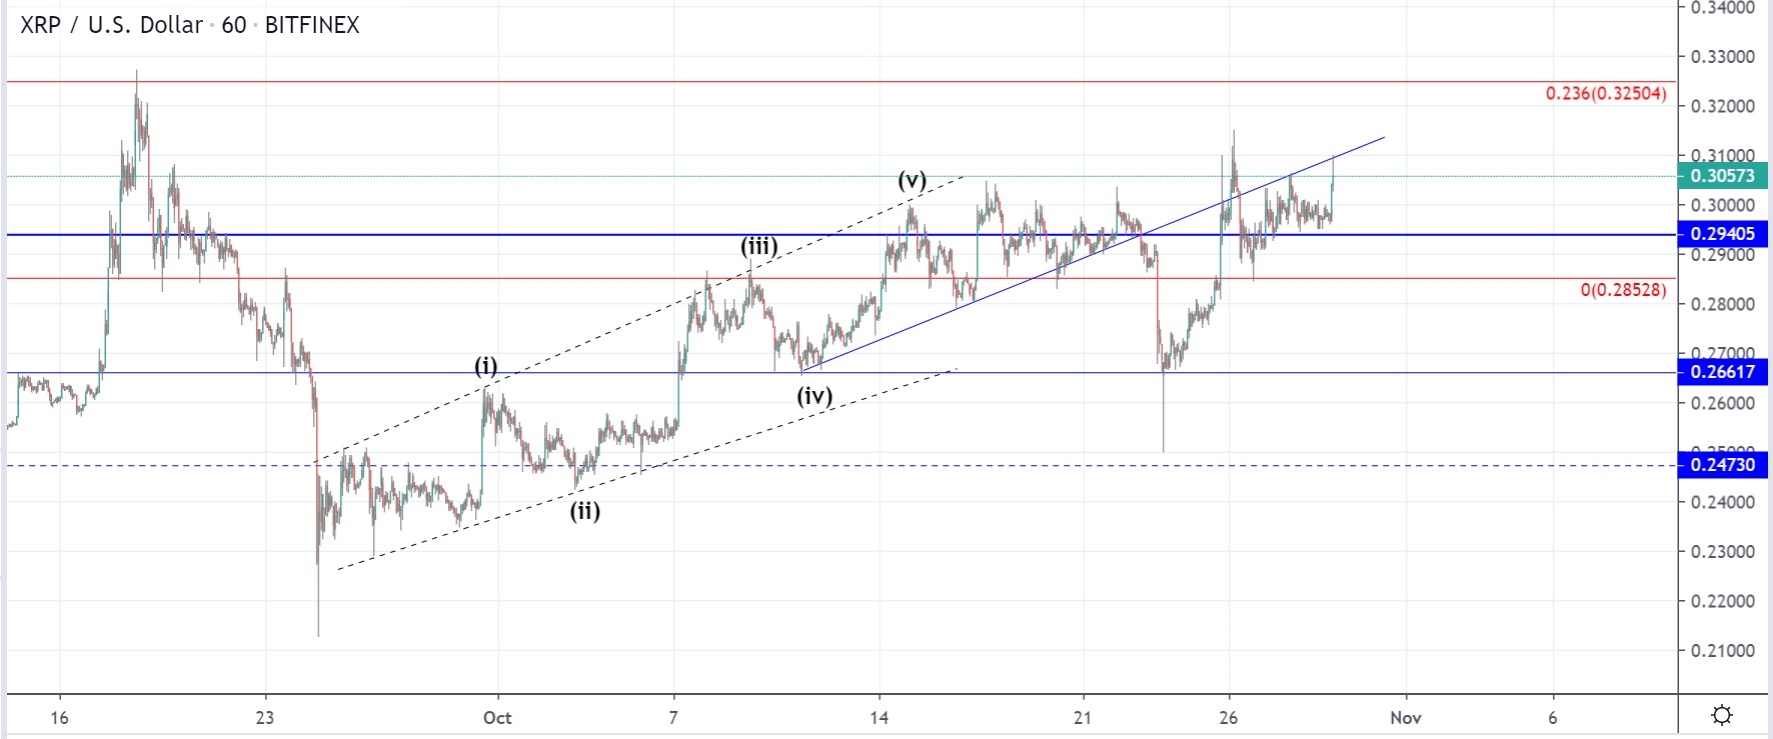
As you can see from the hourly chart, after a retest of the $0.26617 significant level which served as support the price spiked up again above the most significant one at $0.29405 on Friday and was retesting it throughout the following days.
Another upside move started but as the price found resistance at the prior support a retracement back the horizontal support level could look likely. Previously we have seen an ascending channel to the upside in which a five-wave structure developed, and the downfall to the $0.26617 level was in a three-wave manner.
This could be interpreted as the first two waves from the starting 12345 move to the upside in which case the increase we have seen from the $0.266 level would be the first sub-wave of the 3rd wave from the higher degree.
If this is true then upside trend continuation should occur shorty with strong bullish momentum as the 3rd wave is usually the most decisive one.
FXOpen offers the world's most popular cryptocurrency CFDs*, including Bitcoin and Ethereum. Floating spreads, 1:2 leverage — at your service. Open your trading account now or learn more about crypto CFD trading with FXOpen.
*Important: At FXOpen UK, Cryptocurrency trading via CFDs is only available to our Professional clients. They are not available for trading by Retail clients. To find out more information about how this may affect you, please get in touch with our team.
This article represents the opinion of the Companies operating under the FXOpen brand only. It is not to be construed as an offer, solicitation, or recommendation with respect to products and services provided by the Companies operating under the FXOpen brand, nor is it to be considered financial advice.
Stay ahead of the market!
Subscribe now to our mailing list and receive the latest market news and insights delivered directly to your inbox.


Latest articles

Dollar Strengthens Following Fed Verdict
The USD/JPY and USD/CAD currency pairs are showing moderate gains following yesterday’s meeting of the US Federal Reserve. As expected, the American central bank kept its key interest rate unchanged. However, the tone of the accompanying statement

BTC/USD Analysis: Price Edges Close to the $100k Mark
Yesterday, the price of Bitcoin climbed above $99,000 – a level not seen since late February this year.
However, the bullish momentum proved insufficient to breach the psychological $100,000 barrier, and this morning the leading cryptocurrency is holding above

Alphabet (GOOGL) Shares Drop Over 7% in a Single Day
According to the Alphabet (GOOGL) stock chart, yesterday’s main trading session opened around $163.70 but then saw a sharp decline, hitting an intraday low of approximately $148 per share. By the close, bulls managed to recover only a