


FXOpen
Bitcoin prices are trading around the $1,000 figure with no clear direction. Market participants seem to be focused on the upcoming bitcoin ETF decision and ignoring the news from China. Little brother Litecoin entered a short-term bear market last week. As usual, we’ll begin with BTC and come back to Litecoin later in the article.
Bitcoin Traders Wait for ETF Decision
A lot has happened since our last update seven days ago. The major news was the Big Three Chinese exchanges stopping bitcoin and litecoin withdrawals. This initially crashed prices and we saw a low of $913.99 on BTC-E. Shortly thereafter, however, a recovery occurred that sent BTC/USD back to the $1,000 handle. This exact scenario repeated one more time, with prices bottoming out at $963 dollars a few days later.
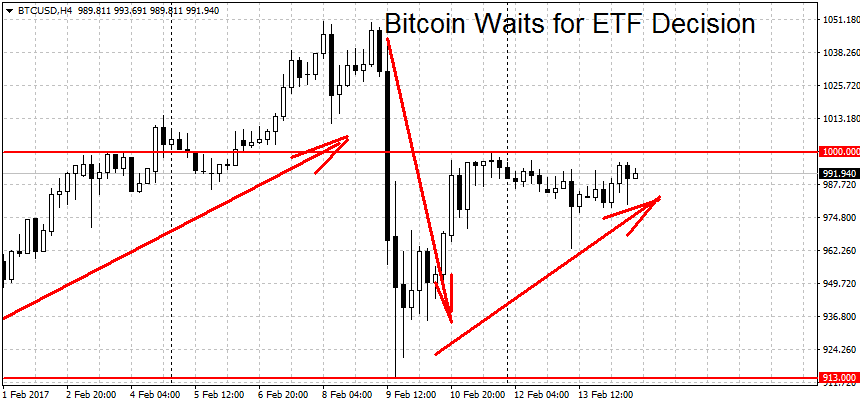
We seem to be stuck around the $1,000 level for now as traders wait for the decision on the bitcoin ETF. The negative news from China continues to be shrugged off in the West as prices trade at $20-$25 premium. In the past, it was Chinese exchanges which ‘lead the charge’. The deadline for the ETF is set for March 10th, although if the decision is negative we will likely hear about it sooner than that. You can read more about the market expectations regarding the ETF here. Googling ‘bitcoin ETF’ will produce a flurry of articles as well.
Technically bitcoin is still in an uptrend. To end it, prices will have to break below the $913 swing low. A new downtrend requires a move below the $875 swing low as well. On the upside, no clear resistance levels can be seen until the multi-year high at $1,096 on FXOpen and $1,160/65 on other USD exchanges.
Litecoin Shares Bitcoin’s Fate
Litecoin shared in bitcoin’s fate this week. As noted above, the Chinese withdrawals ban was applied to Litecoin as well. This led to a sharp drop on February 9th with prices bottoming out at $3.52 dollars. This started a new downtrend for Litecoin.
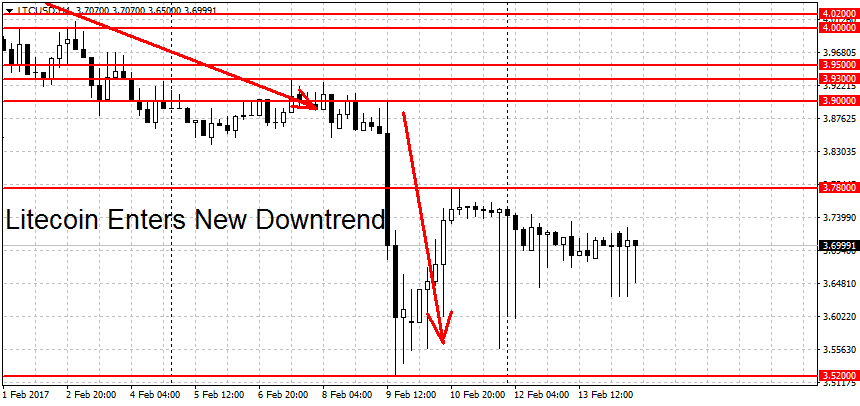
We are currently quoted at $3.70 dollars per coin. Below here we find the first major support is at $3.52, closely followed by several potential support levels at $3.40, $3.36, $3.31 and $3.22 dollars. A clearing of this support area could lead to more LTC losses.
On the other end, a breakout above the $4 round figure would end the current downtrend. A new rally requires a break above the $4.12 swing high as well. On the longer-term charts (weekly and monthly) LTC/USD is range-bound.
FXOpen offers the world's most popular cryptocurrency CFDs*, including Bitcoin and Ethereum. Floating spreads, 1:2 leverage — at your service. Open your trading account now or learn more about crypto CFD trading with FXOpen.
*At FXOpen UK and FXOpen AU, Cryptocurrency CFDs are only available for trading by those clients categorised as Professional clients under FCA Rules and Professional clients under ASIC Rules respectively. They are not available for trading by Retail clients.
This article represents the opinion of the Companies operating under the FXOpen brand only. It is not to be construed as an offer, solicitation, or recommendation with respect to products and services provided by the Companies operating under the FXOpen brand, nor is it to be considered financial advice.
Latest from Cryptocurrencies
Latest articles

What Order Imbalance Is and How To Use It in a Trading Strategy
Understanding the nuances of order imbalances is key for traders looking to navigate the ebb and flow of asset prices. Order imbalances provide a clear window into the supply and demand dynamics at play, offering strategic insights. This article delves

XAU/USD Gold Price Reaches an Important Resistance Zone
The XAU/USD gold chart today indicates that the historical record price of the metal is above USD 2,400 per ounce.
In addition to fears of a new round of inflation due to rising commodity prices, geopolitical tensions are

What Is a Break of Structure and How Can You Trade It?
In the ever-evolving world of Smart Money Concept (SMC) trading, a nuanced understanding of market dynamics is indispensable. This article explores the concept of Break of Structure (BOS), how to identify it, and its implications for trading strategies, setting traders