


FXOpen
Bitcoin volatility jumped as prices rallied $50 dollars since our update last week. But the move up stopped abruptly at the $266 mark and prices retraced nearly all the gains in Sunday’s trading session. The same boom/bust pattern can be seen in other altcoins as they followed big brother, first up, then down.
Bitcoin Rally Stops at $266
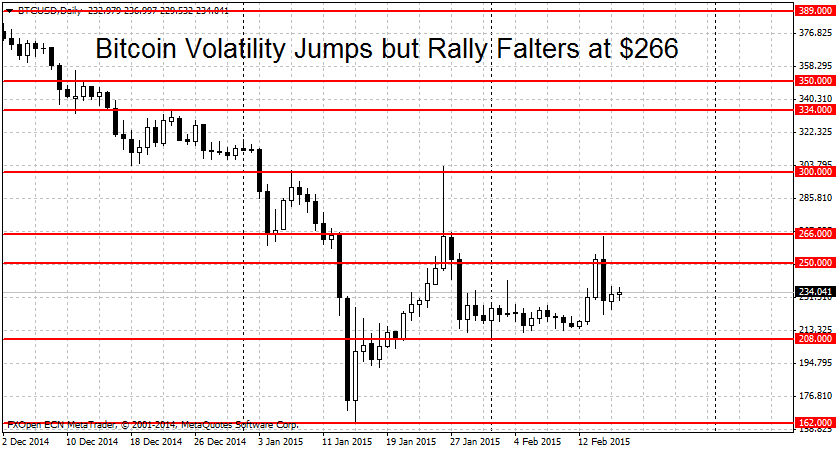
The rally in BTC stopped at the $266 mark. After being ignored by prices during the last rally, this important level has reemerged in prominence this week. Right after hitting a high of $265 flat, bitcoin fell over 50 points to a low of $221.74 on Sunday. Why is $266 important?
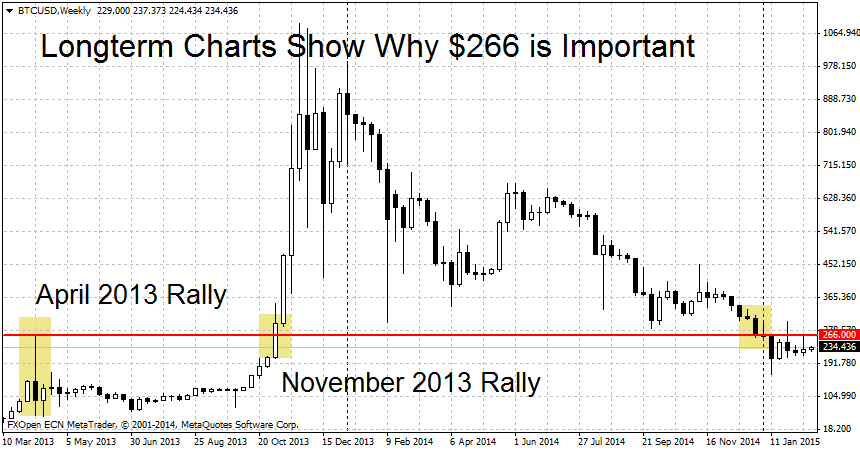
The $266 mark was the swing high reached during the April 2013 rally. It then stayed as the highest high for BTC/USD from April to November of 2013. The second massive rally in November 2013 started after we had breakout above $266. It eventually led to prices of $1090 on November 30th 2013. The large down-move in January of this year happened after $266 gave way on January 13th. Bitcoin fell over almost $100 dollars in the next three days. And now we can add the most recent rejection of prices on February 15th to this mix. Here’s an updated longterm price chart.
What are some of the more important support and resistance levels for bitcoin? On the upside, the $266 level will be crucial. The next retest of prices will likely lead to a breakout higher towards the $300 round figure. This is another important milestone for BTC. The last strong move up stopped on January 26rth at $303 per coin. A clearing of this level may lead to more gains toward $334. On the downside, the $208 swing low will mean a technical end of the current rally. A break below $200 may lead to more losses toward the January 15th lows at $162.
Litecoin Still in Range
Alternative cryptocurrency Litecoin is still trading well inside the breakout bounds mentioned in our article 7 days ago. The rally in LTC/USD stopped at the important $2 dollars figure ($2.017 to be exact). But since we didn’t even get an hourly close above $2, the level wasn’t cleared and thus continues to be valid. A LTC breakout beyond here may lead to a rally towards the January 26th swing high at $2.409. Higher up, the former swing low at $2.64 may now turn into resistance on the way up.
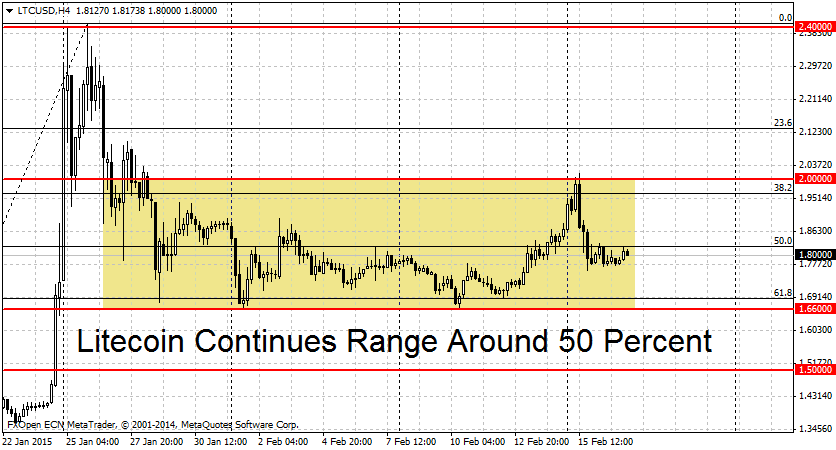
On the lower end, a break below $1.60 (range low at $1.66+buffer for false breakouts) may spark a renewed downtrend in LTC. Notable support levels on the downside include $1.50 (weak), followed by $1.25. But the key number to watch will be the parity level. A breakdown below $1 dollar per coin would exacerbate Litecoin losses.
FXOpen offers the world's most popular cryptocurrency CFDs*, including Bitcoin and Ethereum. Floating spreads, 1:2 leverage — at your service. Open your trading account now or learn more about crypto CFD trading with FXOpen.
*At FXOpen UK and FXOpen AU, Cryptocurrency CFDs are only available for trading by those clients categorised as Professional clients under FCA Rules and Professional clients under ASIC Rules respectively. They are not available for trading by Retail clients.
This article represents the opinion of the Companies operating under the FXOpen brand only. It is not to be construed as an offer, solicitation, or recommendation with respect to products and services provided by the Companies operating under the FXOpen brand, nor is it to be considered financial advice.
Latest articles

AUD/USD Rises Sharply on Inflation News
The Consumer Price Index for Australia was released this morning. According to ForexFactory:
→ CPI in quarterly terms: actual = 1.0%, expected = 0.8%, previous value = 0.6%;
→ CPI in annual terms: actual = 3.5%, expected = 3.4%, previous value = 3.

TSLA Share Price Up About 13% Despite Disappointing Report
Yesterday, TSLA trading closed at USD 144.68 per share, after which Tesla reported its results for the 1st quarter:
→ earnings per share: actual = USD 0.45, forecast = USD 0.49;
→ gross income: actual = USD 21.45 billion, forecast = USD

Market Analysis: Gold Price Corrects Gains While Oil Price Regains Strength
Gold price rallied above $2,400 before correcting lower. Crude oil price is rising and it could climb further higher toward the $85.50 resistance.
Important Takeaways for Gold and Oil Prices Analysis Today
· Gold price rallied significantly above $2,